Which trades keep construction on schedule, and which fall behind? [global construction benchmarks]


By David Milnes
Industry Transformation Manager
share


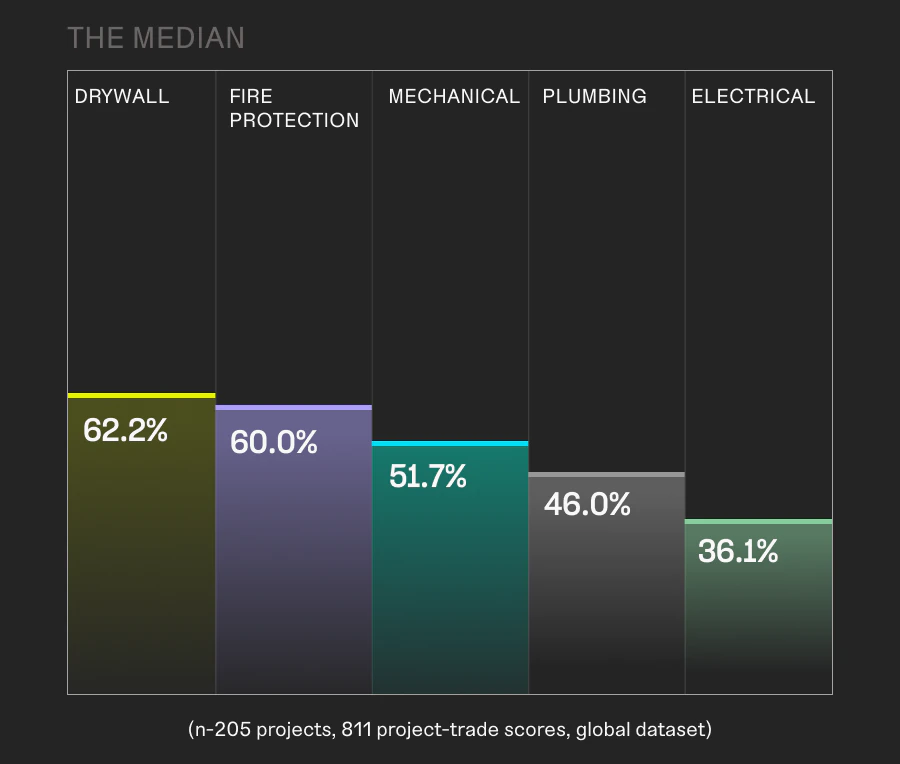
On a typical construction project, drywall crews keep 62.2% of their activities on schedule in any given week. Electrical crews keep just 36.1%.
That 26.1-percentage-point gap between the most and least reliably on-schedule of five major trades is one of the key findings from the Buildots Intelligence Lab’s Global Construction Benchmarks Report. The report draws on anonymized, aggregated progress data from hundreds of construction projects worldwide to measure how work actually progresses on site.
Which construction trades keep work on plan?
Other chapters of the report looked at construction performance across whole projects and individual activities. Across the global dataset, the Buildots Intelligence Lab discovered that only 52.8% of activities on a typical construction project are on schedule in any given week, and sites deliver just 63% of the weekly output their schedules call for.
But projects aren’t built by averages. They’re built by trade contractors working in sequence, each one inheriting the state of the work that came before. A project-level score tells an executive how the job is doing overall. It doesn’t tell a planner where to focus their attention or which trades are likely to need more time than the schedule allows.
So we sliced the same weekly schedule adherence check by trade to see which scopes a schedule can lean on and which need more buffer, earlier coordination, or closer weekly attention. The results are below.
How we measured trade performance on construction sites worldwide
Trade schedule adherence re-slices our broader schedule adherence benchmark by trade. It applies the same weekly, activity-level check against the plan: an activity counts as “on schedule” if it has reached at least 80% of the progress its plan called for by that point. The check is then filtered across five of the most common trade disciplines: drywall, mechanical, electrical, plumbing, and fire protection.
We chose these five because we hold a large dataset for each, and they are typically some of the most critical trades in the fit-out process.
The aim: to turn a broad project health signal into five specific, actionable insights.
How to use this performance metric on your own construction portfolio:
Because progress is checked weekly, activity by activity, tracking trade-level schedule adherence on your own projects can show where a schedule is starting to lose touch with the site, before the slippage spreads to the trades waiting behind it.
A league table, not a blame table.
A trade’s performance score shows where the schedule slips, not necessarily why or who slipped it. Trades inherit each other’s delays: an electrical rough-in can run late because the framing ahead of it did, and drywall closes walls only after the first-fix chaos has been absorbed. These benchmarks map where in the trade sequence plans lose touch with the site. Assigning fault would take a different analysis.
The results: global construction trade performance benchmarks
The global baseline (median): across all five trades measured, median trade schedule adherence is 50%. Half of the work trades are performing is on schedule in a typical week, and half is not.
The median by trade breaks down as:
- Drywall: 62.2%
- Fire Protection: 60.0%
- Mechanical: 51.7%
- Plumbing: 46.0%
- Electrical: 36.1%
The gap: there is a 26.1-percentage-point spread between the most reliably on-schedule trade (drywall, 62.2%) and the least (electrical, 36.1%). Mechanical (51.7%) and plumbing (46.0%) sit between the two. Fire protection reaches 60.0%, alone among the MEP trades in nearly keeping pace with drywall.
Sector highlights: trade performance, by project vertical
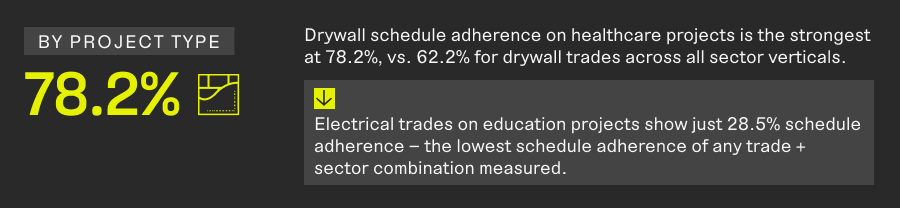
The strongest trade and sector combination: Drywall on healthcare projects is the most reliably on schedule at 78.2%, compared with 62.2% for drywall across all sector verticals.
The weakest trade and sector combination: Electrical trades on education projects keep just 28.5% of their activities on schedule, the lowest of any trade and sector combination measured.
(Sectors studied in this report: residential, commercial, education, healthcare, and data centers.)
What the global trade performance metrics tell us
Even the most on-time trade we studied (drywall) keeps barely 6 in 10 activities on schedule. The league table has a winner, but it doesn’t have a trade that’s actually on schedule.
For planners, that makes this the benchmark that turns data into decisions. A schedule that treats every trade’s dates as equally reliable ignores a 26.1-percentage-point difference between them. Sequencing, buffers, and weekly attention can now be weighted toward the scopes where slippage concentrates, before it spreads to the trades waiting behind them.
My thoughts on trade performance
A planner may know which trades are more likely to experience delays than others. But intuition can’t put a number on it. A 26-point measured gap between trades provides objective data to inform your risk judgment when planning. If drywall achieves 62% schedule adherence and electrical only achieves 36%, contingency, time risk allowance, look-aheads, and the supervisor’s attention should be considered with that in mind.
It is no surprise that trades with the most complex work, in the most congested work fronts, rank lower. That’s not a reason to hassle your electrical contractor. It’s a reason to plan carefully and focus mitigation efforts in the right places to best manage risk.”
Get more global construction benchmarks in the full report
Trade performance is one of four benchmark areas in our Global Construction Benchmarks Report. We studied more than 200 construction projects worldwide to establish new industry benchmarks across the full picture of site performance, including:
- Schedule adherence: how often work stays on plan, including on-time start rate and completion overrun. On a typical project, just 52.8% of activities are on schedule in any given week.
- Planned vs. actual output: how much of the weekly production schedules call for gets delivered, plus production rates for 21 core construction activities. The typical project delivers 63% of planned weekly output.
- Peak vs. typical performance: what sites can produce in their best weeks compared with a typical week. Peak four-week output runs 82.9% above typical weekly output.
These are construction industry benchmarks you won’t find anywhere else, researched and published by the Buildots Intelligence Lab.

Download the full Global Construction Benchmarks Report for free here.
David Milnes
Industry Transformation Manager