How often do construction activities stay on schedule? [global construction benchmarks]


By David Milnes
Industry Transformation Manager
share


On a typical construction site, only half (52.8%) of construction activities are on schedule in any given week.
That’s one of the key findings from the Buildots Intelligence Lab’s Global Construction Benchmarks Report, which draws on anonymized, aggregated progress data from hundreds of construction projects worldwide to measure how work actually progresses on site.
Are construction projects staying on schedule?
Before a construction project finishes late, the work slips somewhere along the way. To avoid surprises at the finish line, it’s worth taking a regular pulse check: is this week’s work on track?
We took a weekly snapshot of every in-progress activity across 227 construction sites worldwide to track what share of live work stays on schedule in a typical week, on a typical project.
How we measured schedule adherence on construction sites worldwide
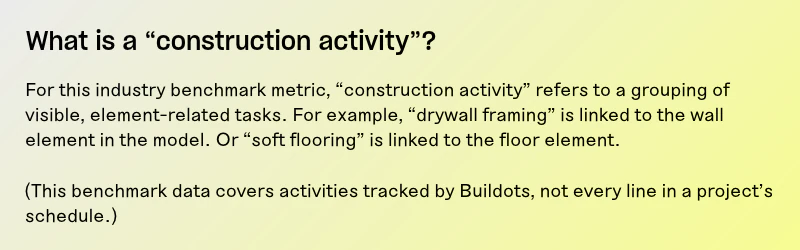
Schedule adherence measures the share of active construction tasks (or ‘activities’) that are running on or ahead of schedule in a typical week. (An activity counts as on schedule if it has reached at least 80% of the progress its plan called for by that point. Each activity is scored from its first measured progress until completion or its planned end date passes.)
The aim: to establish a reliable baseline for how construction schedules perform in practice, not just on paper.
How to use this performance metric on your own construction portfolio:
Because progress is checked continuously rather than waiting for a milestone date to pass, tracking weekly schedule adherence on your own projects can help you catch problems as they happen – before they compound into major delays.
The results: global construction schedule adherence benchmarks
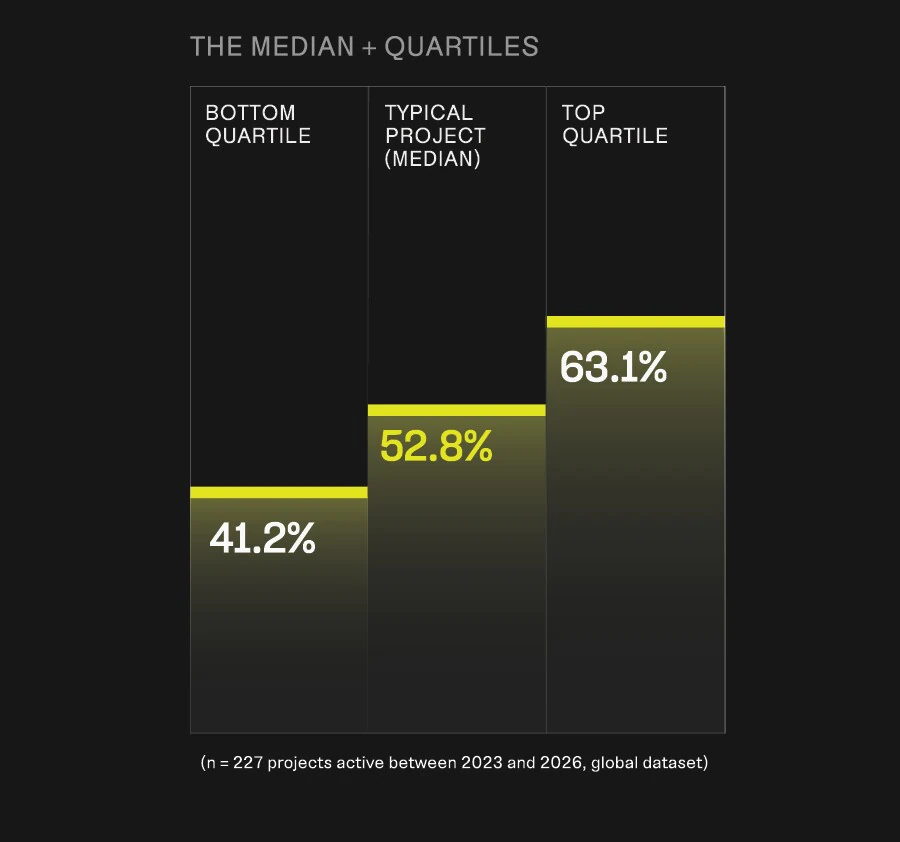
- The global baseline (median): On a typical construction project, just 52.8% of activities are on schedule in a typical week. – This means 47.2% of all active work is behind schedule.
- Top-quartile projects: keep 63.1% of activities on schedule in a typical week.
- Bottom-quartile projects: keep 41.2% of activities on schedule in a typical week.
- The gap: There is a 21.9-percentage-point gap between top-quartile projects (63.1% schedule adherence) and bottom-quartile projects (41.2% schedule adherence).
Sector highlights: schedule adherence, by project vertical
The winning sector:
Healthcare construction projects lead the pack in schedule adherence, with 60.3% of all active work on schedule in a given week (compared to the global median of 52.8%).
The trailing sector:
Commercial projects trail other sectors on schedule adherence, with just 45.2% of activities on schedule in a typical week.
(Sectors studied in this report: residential, commercial, education, healthcare, and data centers.)
What the global construction schedule adherence metrics tell us
In construction, keeping pace with the plan is a coin flip: the typical project keeps just 52.8% of its activities on schedule in any given week.
Delay is not a one-off crisis event in construction; it’s the normal operating condition of an ordinary week. Even top-quartile projects keep only 63.1% of activities on schedule, and bottom-quartile projects fall to 41.2% adherence to plan, with “behind schedule” becoming the default state of work on site.
The 21.9 percentage-point gap between top and bottom quartiles is notable: a spread that wide likely isn’t solely down to weather or luck.

“When roughly half of all active work is running behind in any given week, delay ceases to be an anomaly in construction; it becomes the norm. That is the sad reality the construction industry has rationalized as accepted performance by focusing on the wrong indicators.
Traditional reporting conceals day-to-day friction until it’s too late to easily fix. However, tracking weekly schedule adherence exposes that hidden drift as it happens, giving executive leadership the leading indicators they need to intervene while the critical path can still be protected.”
Jeremy Tully, AMTS Executive (previously Senior Director of Digital Transformation, Intel)
Get more global construction benchmarks
In our Global Construction Benchmarks Report, we also studied hundreds of projects to develop new industry benchmarks for other elements of schedule adherence, including:
- On-time start rate: The share of scheduled activities that start on time or early.
- Completion overrun: How many weeks late the typical construction activity finished.
Plus, you’ll get data on trade performance, planned vs. actual output, activity production rates, and what construction sites can produce in their best weeks vs. a typical week.
Download the full Global Construction Benchmarks Report for free here.

David Milnes
Industry Transformation Manager