Grounding ambition in evidence: Benchmarking healthcare planning


By Amir Berman
VP Industry Transformation
share
Predictability is key for the construction industry, but in the healthcare sector, it’s more than a project management KPI – it’s a clinical necessity. When a project slips, it isn’t just a budget issue; it’s a delay in patient care.
To achieve true predictability, contractors and executives need more than “gut feel”. They need a baseline of what “reasonable” actually looks like. That’s why our team analyzed weekly planned production rates across healthcare projects for North America and the UK, to establish industry-wide benchmarks for key trades in Interior (or Architectural) and MEP (Mechanical, Electrical and Plumbing). Take a look at the results for each region below:
North America Benchmarks
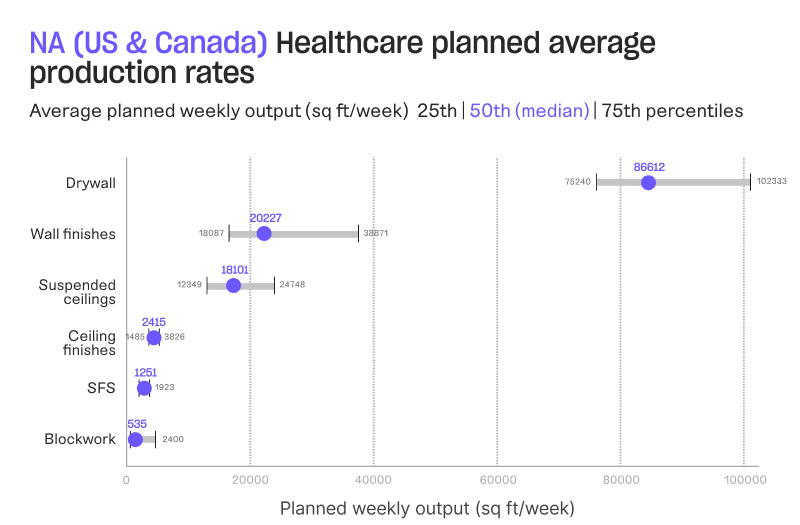
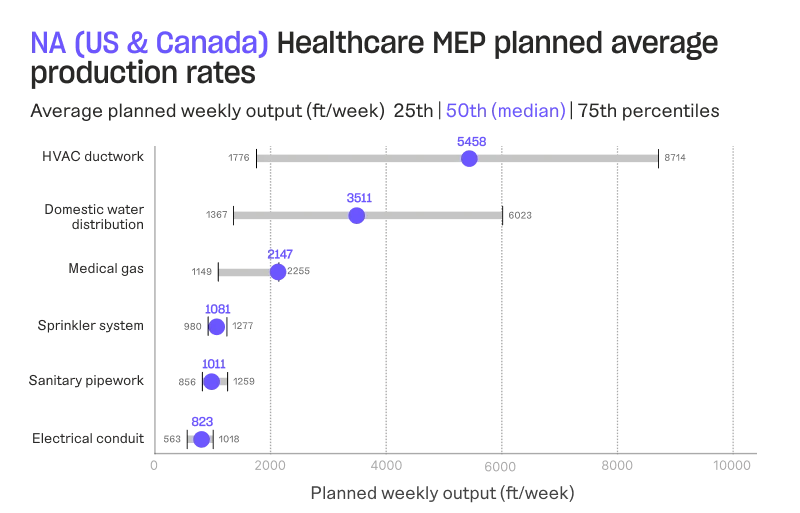
| Median benchmark for interior planned production rates (sq ft/week) | Median benchmark for MEP planned production rates (ft/week) |
| Drywall – 86,612 Wall finishes – 20,227 Suspended ceilings – 18,101 Ceiling finishes – 2,415 SFS – 1,251 Blockwork – 535 | HVAC ductwork – 5,458 Domestic water distribution – 3,511 Medical gas – 2,147 Sprinkler system – 1,081 Sanitary pipework – 1,011 Electrical conduit – 823 |
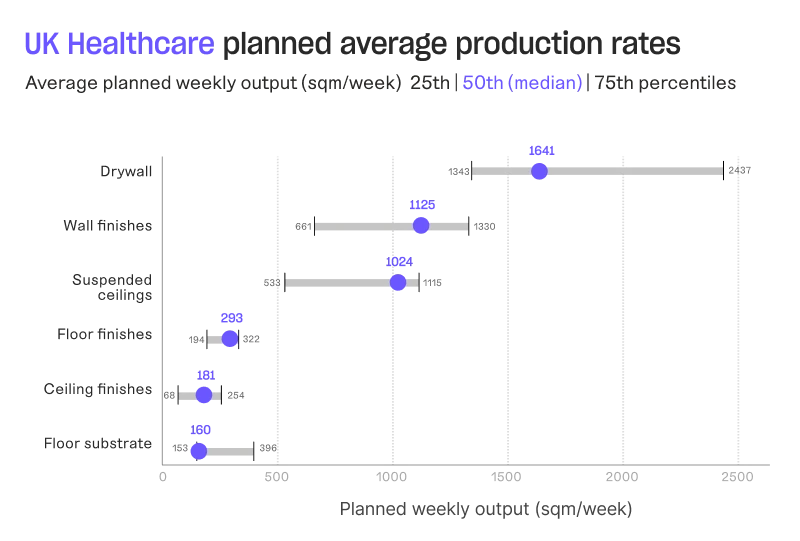
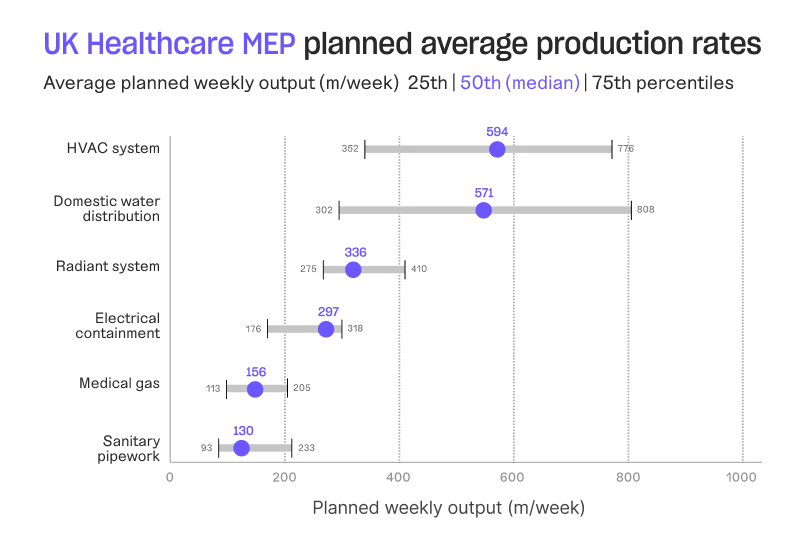
UK Benchmarks
| Median benchmark for interior planned production rates (sqm/week) | Median benchmark for MEP planned production rates (m/week) |
| Drywall – 1,641 Wall finishes – 1,125 Suspended ceilings – 1,024 Floor finishes – 293 Ceiling finishes – 181 Floor substrate – 160 | HVAC system – 594 Domestic water distribution – 571 Radiant system – 336 Electrical containment – 297 Medical gas – 156 Sanitary pipework – 130 |
So, what does this mean?
So what does it mean for you, beyond the weekly report? Knowing what reasonable looks like gives you the following benefits:
- Competitive Edge: Know if your production rates actually stack up against the market.
- Realistic Scheduling: Stress-test your entire program’s assumptions against historical facts.
- Commitment Accuracy: Ensure your promises to stakeholders are backed by data, not hope.
By benchmarking your production rates against these North American and UK benchmarks, you can move beyond hope-based scheduling to create realistic, data-backed programs. This gives you greater predictability for your projects, giving you a competitive advantage while safeguarding the patient care that depends on your timely delivery.
Amir Berman
VP Industry Transformation