Schedule adherence: What does it mean when half of in-progress activities are off track?

By Amir Berman
VP Industry Transformation
share
Every project has a plan. The question is how closely reality tracks it – week by week, activity by activity, across the full life of the build. Our team set out to measure exactly this across more than 200 anonymized global construction projects.
What we found may surprise you, especially if you’re an optimist. Across all the projects, the average rate of schedule adherence is 48%.
Schedule adherence measures the proportion of ongoing construction activities that are on or ahead of their planned progress in a given week. A score of 48% means that, in the average week on the average project, roughly half of all ongoing activities are on track. The other half aren’t.
We aren’t talking about the worst projects here. Outliers, projects in crisis that become case studies at industry events. This is a random selection of projects across different geographies and types. And 48% is the average figure.
What is schedule adherence?
It’s important to get our definitions right here. Schedule adherence is the number of ongoing construction activities that meet their planned progress in a given week, divided by the total number of ongoing activities that week. The result is a single number, expressed as a percentage. So, to put it extremely simply, if you had 20 activities in progress and 10 of them were on schedule, your schedule adherence rate for that week would be 50%.

To make the metric more accurate, we averaged those weekly percentages over the life of the project and weighted them so that busier weeks, when more activities are running simultaneously, carry more influence on the final score.
If you're familiar with Percent Plan Complete (PPC), you might be wondering whether this is just the same thing with a different name. It isn't!
PPC asks whether the team met their commitments this week. Schedule adherence asks how the project is tracking its master schedule over time. In theory, consistent PPC should produce strong schedule adherence. But the relationship can break down. PPC is vulnerable to sandbagging: teams that commit only to tasks they're confident they can complete can sustain strong weekly scores while the schedule quietly drifts. The most telling signal is when the two diverge. High PPC alongside falling schedule adherence suggests that the weekly planning culture has decoupled from schedule reality.
Differences by project type and region
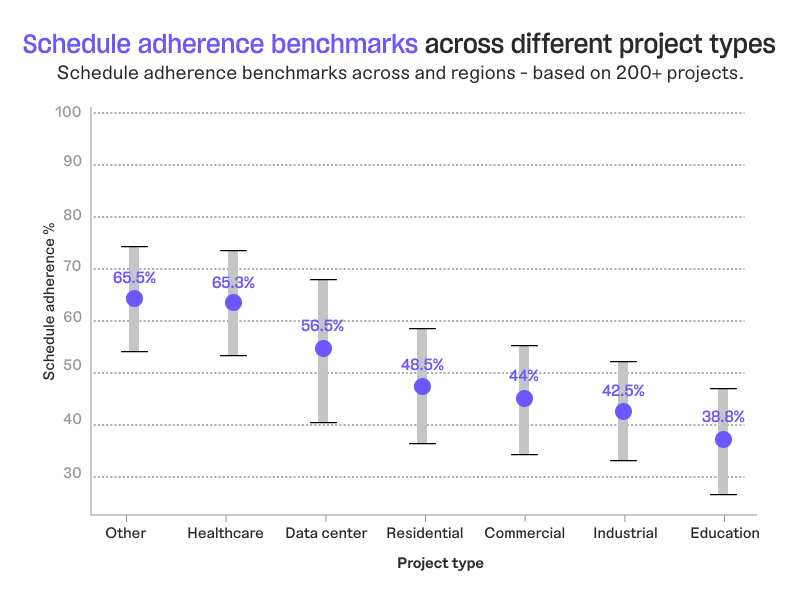
Not all projects start from the same place. Across the sectors we analyzed, healthcare leads with an average adherence of 65%. Data centers follow at around 57%. Commercial and industrial projects sit in the low-to-mid 40s. Education comes in lowest at just under 39%.
Mission-critical project types (healthcare and data centers) tend to show stronger adherence than other project types. These are environments where schedule pressure is more acute, contractual consequences are more severe, and the incentive to track and recover is higher. Whether that stronger performance reflects better planning, tighter execution, or both is a question worth investigating.
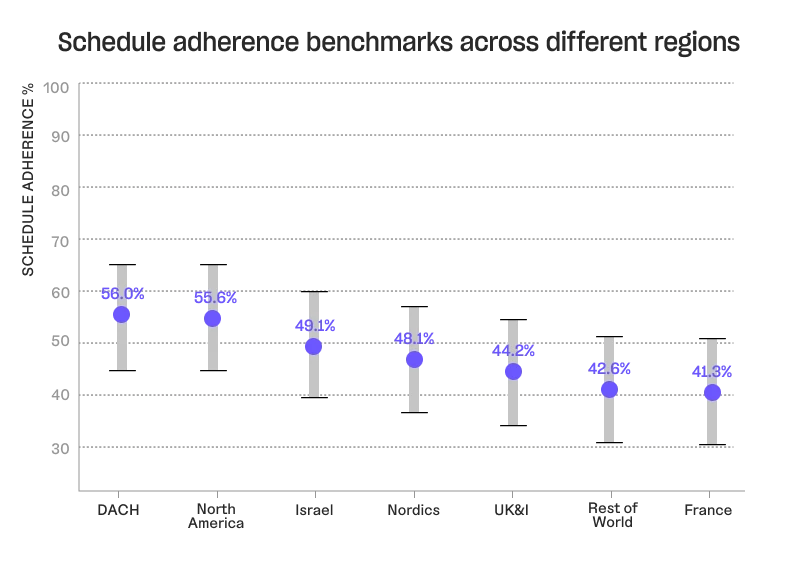
The regional picture tells a similar story with a different shape. North America and DACH both sit around 55-56%. UK&I and France cluster in the low 40s – a gap of roughly 12-15%. Our previous analysis of work in progress found the same directional result. North American projects outperform UK projects on the completion-to-WIP ratio by more than 20%. It’s hard to draw definitive conclusions, but this consistency might suggest something structural. For example, planning culture, contract structures, workforce organization, or some combination of all three.
The spread is the real story
The averages tell you where to orient yourself – where your sector typically lands, what's normal for your region. But they only tell half the story. The other half is what happens within those averages, and is arguably the most interesting.
Consider two data center projects from our sample that are located in the same region. We can assume that they’re both subject to the same market pressures, the same client expectations, the same general conditions. One scored 94% schedule adherence. The other scored 36%.
That’s an astounding 58% difference between the two projects. One is essentially running to schedule. The other is consistently behind, in the majority of weeks, on the majority of active activities.
That gap doesn't appear by accident. And it doesn't close by accident either.
A higher adherence score could reflect better planning. For example, schedules built with production rates that reflect what trades can actually deliver, rather than reflecting overly ambitious commitments made at the beginning. It could also reflect better execution: tighter coordination, earlier problem identification, faster recovery. Most likely, it’s some combination of both. But the point is that high performance is clearly achievable. The 94% project proves it.

What does this mean for me?
Overall, the implication for project teams is this: if one project in your sector and region can achieve 94% adherence while another achieves 36%, the gap between them isn't fate. It's something that can be understood, measured, and closed.
But there are also some more specific conclusions to be drawn:
- For planners, the low schedule adherence rates we found raise the question of whether many schedules are built with production rates that have any empirical basis. Or in other words, does the plan reflect what trades have historically achieved, or simply what the contract requires? Optimistic planning followed by poor adherence is a pattern that repeats often. Measuring adherence is one way to break it.
- For project leaders, it surfaces an accountability question. If half of all active activities are missing their planned progress in the average week, it’s important to investigate further and understand which half. Are the same activities consistently slipping? Is the miss concentrated in a single trade, a single floor, a single phase?
- And for anyone managing a schedule, if your project end date isn't changing but your adherence score is falling, what does that tell you about the compression accumulating in your schedule? The gap between plan and reality doesn't disappear. It usually just moves to the end of the project.
Construction has no shortage of reports and opinions. What it often lacks is clear, data-driven signals that cut through the noise and tell you whether your project is on track. Schedule adherence is one of those signals. The question is whether you're measuring it.
Amir Berman
VP Industry Transformation