A single view to compare every schedule: Introducing Schedule Status
Almost every major construction project runs on two schedules that tell different stories to different stakeholders.
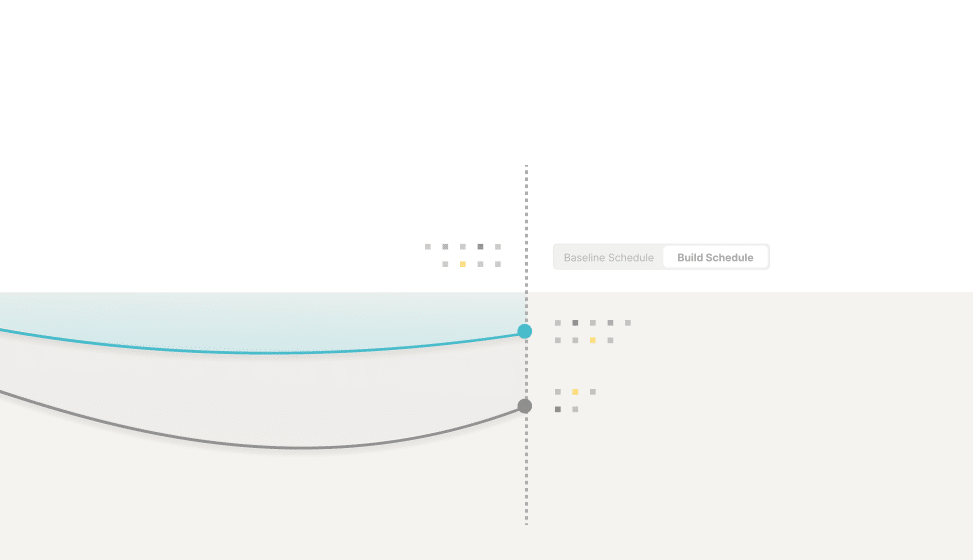
There’s the baseline contract schedule, which is shared with the client to set expectations and milestones. And there’s the build schedule, the one used on site to drive day-to-day execution. Often, there’s also an internal short-term or mitigation plan.
Each schedule has different owners, update cycles, and built-in float. As the project progresses, they inevitably diverge. When this happens, teams can struggle to see how much and where. Without a clear way to compare them, it can be time-consuming and tricky to figure out whether you’re truly on track, burning float, or heading toward a deadline miss.
That’s why we built Schedule Status.
See progress from every angle
With Schedule Status, Buildots brings the build and baseline contract schedules together in one place, transforming how teams assess progress and risk.
Instead of juggling spreadsheets or manually cross-checking milestones, teams can now see exactly where the project stands on both timelines, measured in actual days rather than abstract percentages. The result is a clear, contextual understanding of performance that keeps everyone aligned.
For example, imagine a project that’s 50% complete by month six. If the build plan calls for 55%, it may look behind. But if the baseline says 45%, it’s actually ahead. While the pace still needs watching, there’s no need for panic. Schedule Status provides the clarity to see the full picture.
Here’s what it delivers:
- Metrics in context: Assess progress against both schedules to get a true picture of project health. Instantly see if you’re ahead, behind, or using up float without digging through layers of data.
- Customizable scope: Sometimes you’re laser-focused on hitting the next milestone! Easily filter by building, floor, trade, or activity to focus on what matters most right now.
- Behind-schedule activities: Identify delays early enough to intervene, then drill down by location to understand what’s driving them.
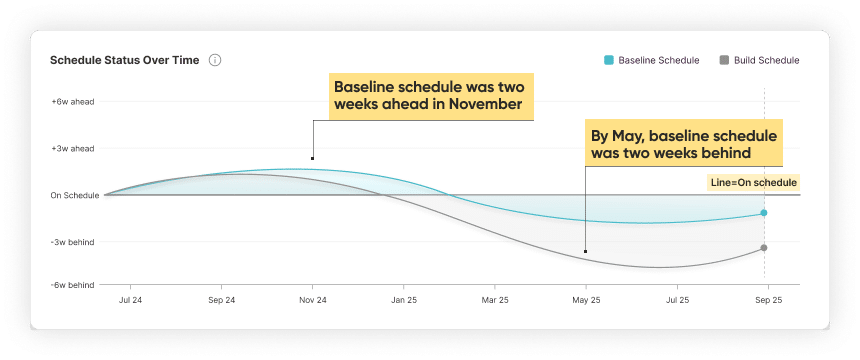
- Analytics and variance graphs: Track schedule trends over time to visualize how performance shifts as the project evolves.
- Report exports: Generate tailored reports with one or both schedules, sharing relevant progress data with owners, trades, and subcontractors.
Communication everyone can get on board with
When we built Schedule Status, we obviously wanted it to make it easier for project teams to know where they stand today. But beyond that, our main goal was to give these teams a tool to clearly and confidently communicate that position to other stakeholders, whether reporting to owners, coordinating with trades, or reviewing progress internally.
For instance, teams can now show baseline-only progress, based on real site data, to owners for clarity, while keeping dual-schedule comparisons for internal management. This helps them report with confidence and avoid misinterpretation.
It’s about tailoring the message to ensure each stakeholder sees what’s most relevant to them
One source of schedule truth
Schedule Status brings a new level of visibility to one of construction’s toughest challenges: staying aligned between what’s promised and what’s being built.
By uniting the contract and build schedules, Buildots provides a shared, objective source of truth that eliminates confusion, aligns expectations, and enables proactive control.
It’s another step toward true operational excellence in construction.
See how Schedule Status can bring new clarity to your schedule. Get in touch with our team.