The last 20%: New data on how construction activities stall at the finish line

By Amir Berman
VP Industry Transformation
share
At some point, every project manager has had the same thought: “Finishing this activity is taking forever.” It’s that agonizing crawl toward the finish line where a task remains “90% done” for weeks on end.
While this feels undeniably true onsite, it’s a phenomenon that is rarely measured. So, we decided to put anecdotal experience to the test by asking a simple question: How long does the final 20% of an activity actually take? And does this vary by activity type?
What we measured
To find the answer, we analyzed 40 activity types across 102 global projects in a range of verticals – residential, office, education, industrial, healthcare, and commercial.
For each activity on each project, we built a cumulative progress curve from the first to last week of actual output. We then identified when the activity reached 80% completion and measured how much of the total duration came after that point.
In a perfectly linear world, 20% of the scope should take 20% of the time. That’s our baseline. We wanted to see how far real-world activities deviate from that line, and whether those deviations follow a predictable pattern.
What we found
Our analysis showed that the median construction activity spent 27% of its duration on the final 20% of its scope. While that is modestly above the 20% linear benchmark, the median doesn’t tell the whole story.
There’s a huge range in how long the final 20% of work takes, depending on the activity:
- In 44% of cases, it took 30% or more of the total duration
- In 24% of cases, it took 40% or more
- In 12% of cases, it took 50% or more
When activities took significantly longer than 20% of the time to complete the final 20%, we dubbed them “long tail activities.”
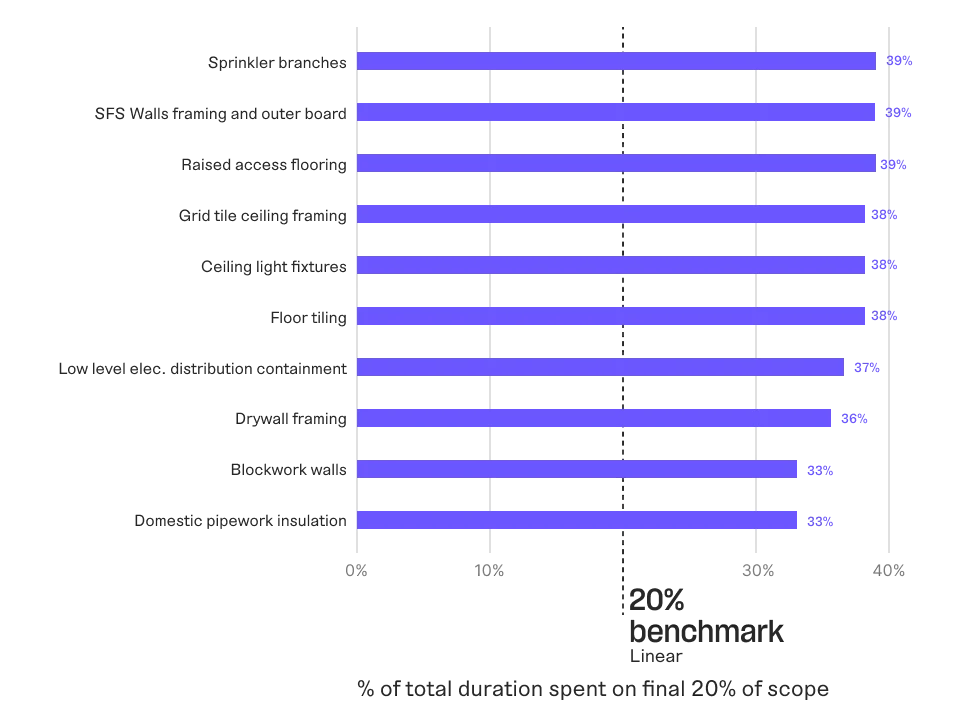
What’s more revealing is that certain activities consistently have long tails, while others don’t. The spread is meaningful: drywall closure finishes its last 20% in just 11% of its duration, while sprinkler branches take 39%. That’s a 3x difference in the “crawl to the finish” based purely on the trade.
Here’s a list of the “top offenders” – activities that took 33-39% of the duration to complete the final 20% of work.
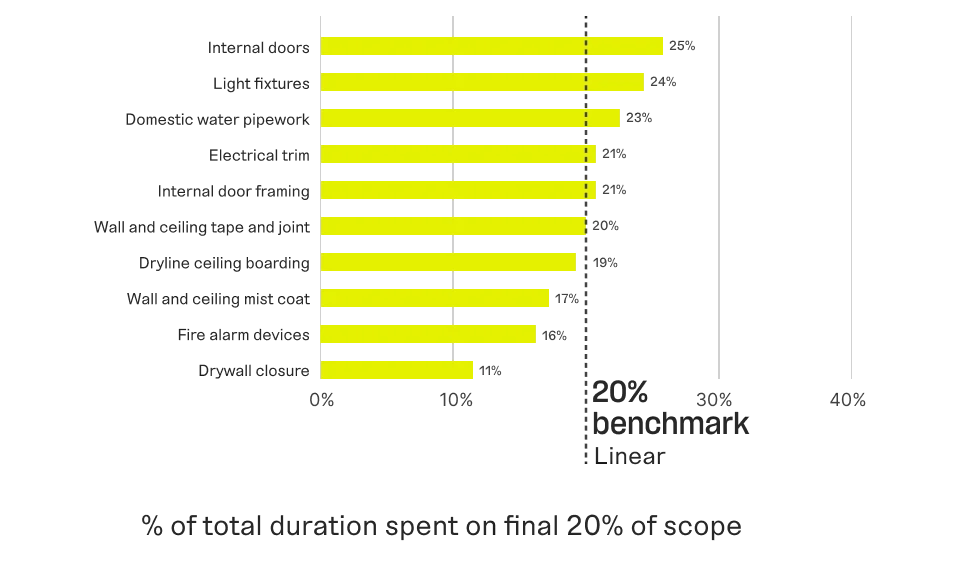
By contrast, these activities were the most efficient, finishing the last 20% in 25% or less of the duration, closest to the linear benchmark.
Why does this happen?
The pattern is consistent enough to suggest something structural. While we don’t have all the answers, we noticed that the longest-tail activities tend to be trades that depend on access to many locations across a project. For example, sprinkler branches need to reach every zone and floor. Floor tiling covers every room. Ceiling framing spans every corridor. Once the main push is done, finishing these activities requires working through small, scattered, hard-to-access pockets of remaining scope. Those pockets are slow.
By contrast, the shortest-tail activities tend to be either discrete installations, such as doors, fire alarm devices, light fixtures, or finishing passes over already-prepared surfaces, like mist coat, tape and joint, and drywall closure. Once the preparation work is done, these trades can move fast because their remaining scope isn’t geographically scattered in the same way.
This isn’t a universal rule. Drywall framing, for instance, often has a long tail despite being a major structural activity. But the general pattern holds: activities that need to reach everywhere tend to struggle to complete efficiently.
What does this mean for me?
For planners, the implication is direct. A schedule that assumes linear burn-down to completion will systematically underestimate the tail on certain activities. If you’ve allocated ten weeks to sprinkler branches based on a linear assumption, the data suggests that roughly four of those weeks will be spent just on the final 20% of the scope. The last floors, the last zones, and the “awkward” locations will always take disproportionately long.
For project leaders, the actionable takeaway is knowing which activities to watch. The “top offenders” list shows where the data consistently shows schedules slipping. If one of those activities is on your critical path, its nominal completion date is likely later than your current schedule suggests. Monitoring these trades early is the only way to prevent a (slow-motion) car crash at the end of the project.
For the industry, the broader observation is that activity duration isn't a “one-size-fits-all” curve. Some activities progress linearly, some front-load, and others tail off for weeks. Schedules built on a single, assumed profile simply don’t match the physics of a modern job site. The closer our planning gets to activity-specific realism, the more honest and achievable our expectations become.
***
Methodology
- We measured the % of total activity duration spent completing the final 20% of the scope, per project and activity combination.
- We included 102 global projects in our analysis, including multiple project types – residential, office, education, industrial, healthcare, and commercial.
- All activities had at least 8 weeks of actual progress data and data from at least 8 projects (to avoid small-sample conclusions). 40 activity types and 1,077 project-activity combinations met this threshold.
Amir Berman
VP Industry Transformation