Construction Analytics The Power Of Data With Faster, More Adaptive Reports

The construction industry's project-based nature demands fast and accurate decision-making to ensure work progresses on time and within budget. But, when it comes to gathering and analyzing data that accurately reflects the work on-site, teams often face several challenges.
The need to overcome these challenges and tackle the low productivity reported in the industry is glaringly obvious. Rework accounts for around 5% of total project costs, and large projects are reported to take 20% longer than scheduled. Being able to integrate data at the project level, track metrics, and standardize data collection can greatly improve decision-making and mitigate risks related to delays, overpayments, and errors.
Business intelligence tools can help companies achieve this by offering data visualization in easy-to-use formats. The increased flexibility in the way teams view their data can give them a deeper understanding of what's happening on their projects.
In this article, we'll discuss the pain points related to gathering data on-site, providing accurate reports, and how access to the right data in the right format can improve decision-making on construction projects and tackle the low productivity in the industry.
Project Data Pain Points
The industry has been developing its own ways of working for a long time. Construction companies have developed different data and reporting strategies. In order for them to adopt new technologies, it requires a level of customization in both the variety of data sources and the metrics themselves. It can take precious time to adapt to different ways of tracking activities and in-house experts, which teams don't readily have.
Meanwhile, executive teams overseeing key metrics, milestones, and overall delivery of the project need to be able to accurately report back to stakeholders to keep them updated on the current status, projections and the reasoning behind future plans and changes. Whereas project and site managers/superintendents need an early warning of negative productivity trends and risks to meeting project milestones, so they can identify the root causes of issues and fix them quickly to keep work on schedule. This results in a disconnect between decision-making and the work on-site.
Another major area affected by this disconnect is the ability to bill and pay for actual work completed and manage cash flow. Gauging whether spending is in line with relative earnings, whether they are under or over budget, or they are paying for work that has actually been completed and can cover the work that remains is a hard enough task. In theory, it should be an exact science, but on-site conditions can make that almost impossible. Having reports that can answer these questions becomes invaluable because it's not actually tight margins that bring down a company its cash flow.
A lot of time is spent gathering data. Due to the dynamic nature of large projects, it results in siloed datasets and teams dealing with different realities. Combined with many data sources on a construction site, it can create an even more complicated situation for construction teams who need to carefully navigate their way through it. The volume of data and the data silos may be more technically complex than some construction teams can manage. It can impact the ability to closely monitor metrics and access the data that matters.
All these pain points are probably very familiar and easy to relate to. That's why building reports that can process large volumes of data and present it in easily consumable ways can help teams address project needs and solve each of these challenges.
Providing Value Throughout The Lifecycle Of A Project
Rather than spending time gathering data on job sites, project managers can focus on higher-value activities and communicate more effectively with stakeholders. They can monitor factors that affect progress, such as mitigating risks from trades to ensure the quality of the build, and use the reports to make their work sites more efficient, productive, and safe.
The real value of business intelligence reports becomes apparent once you start collecting data from multiple projects. The reports provide the possibility to extract cross-project insights and benchmarks. By using insights to benchmark activities, teams can better predict how long a project will take to complete and which areas are likely to incur additional costs. They can use these insights to fine-tune plans and improve the delivery of future projects.
Supporting Decision-Making For Processes On And Off-Site
Identifying and understanding the key areas of your project that you want to measure can help you deliver a successful project. With technological advances in progress management and business intelligence solutions, you no longer need to spend hours of manual work sorting the data and analyzing it yourself. For example, at Buildots, we conduct a quick discovery process to identify and understand the customers' key business needs to have a successful project. Using AI machine learning and Power BI embedded into our tool, we build faster and more adaptive reports that support added value and align with company-specific reporting formats. They are dynamic and updated every time the user captures the site.
For example, our client Tidhar has very specific workflows that define their progress reports. Our team of data construction specialists, built up of engineers, analysts, data scientists, and BI developers were able to build Tidhar the reports they were after. Once they saw their data visualized on the Buildots dashboard and the value it added, they requested additional reports to help them with their project management.
“A large part of Tidhar's success lies in adhering to our practices and project management methods. We consider Buildots an excellent partner because of the groundbreaking technology they developed to automatically track project progress and their ability to adapt to these practices, organizational guidelines, and project requirements.”
Amir Putievsky, VP Construction, Tidhar construction.

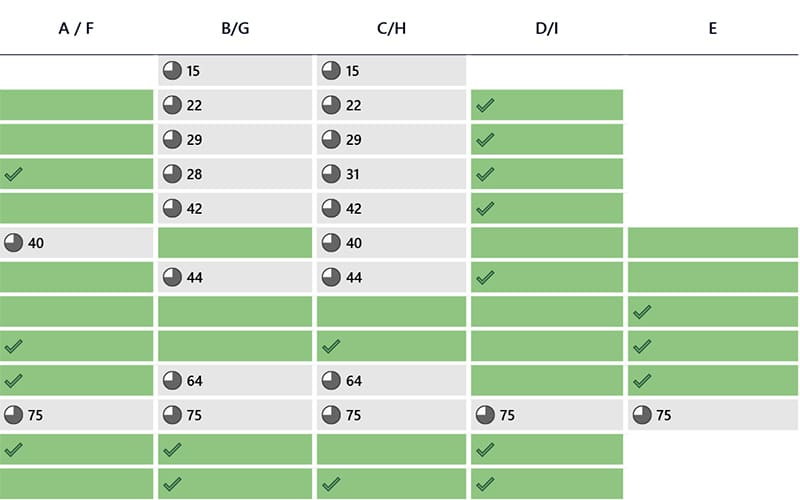
Reports can answer a number of on-site questions. For example, another client requested a report that measured overall subcontractor performance, a breakdown of each subcontractor's progress against the schedule and the number of business days each subcontractor was delayed. Having the information at hand without any of the manual process and the visuals to back up each data set meant they could plan the week more efficiently. If one subcontractor was behind, they could determine how that would impact the others, whether they needed to call in more labourers or rearrange the schedule. This data could help them reach key milestones, avoid disputes and prevent a bottleneck of activities.
Endless Possibilities With Customized Reports
Improving the flexibility of how data is viewed can help solve some of the challenges construction companies have faced for decades. Reports that provide new insights and answer the “latent needs” of construction teams are a valuable resource and are not to be overlooked. The insights can improve decision-making and reduce errors and delays.
Ultimately you have more control with less effort. Instead of spending time collecting and analyzing data, teams can use the information to plan and manage projects more efficiently, revolutionizing how they work. With better insights, they can quantify what is happening on-site; and know what happened and why it happened. The effect is to align everybody, and productivity goes up.
Webinar
Construction Analytics Based On Power BI


