What happens when work stops? The real cost of ‘Zero-Progress Weeks’

Recently, our team at Buildots has been exploring (as we often do) the underlying mechanics of construction delivery, looking for early signals that help teams deliver more efficiently. While investigating the drivers of Production Attainment (the ratio of actual versus planned output), we stumbled upon a powerful correlation with ‘Zero-Progress Weeks’ (weeks when an active task doesn’t move forward despite planned progress).
As we analyzed projects across drywall framing and MEP rough-in stages, a clear pattern emerged. Weeks with zero actual progress appear to be a strong indicator of future efficiency loss. In other words, when a task stops completely, it doesn’t just delay the work. It also seems to reduce a team’s ability to recover and hit their targets for the remainder of that activity.

We’re sharing this insight now not as a final verdict, but as a step in a bigger process. Construction is too complex for one organization or dataset to claim universal truth. Our goal is to put this on the table, pressure-test it with the people who live it every day, and learn together. What matters most is whether this helps teams act earlier and deliver predictably.
Now, let’s dive into the details.
Defining the core metric: Production Attainment
To measure the impact of work interruptions, we analyzed Production Attainment, an operational metric that isolates execution efficiency from general schedule progress.
Production Attainment measures whether actual construction output aligns with the planned output over a given period. Or in other words, did the team complete as much as they planned? More? Less?
Unlike percentage-complete metrics, Production Attainment reflects the health of the workflow and how reliably a team can turn plans into output.

1.0 means they’re executing exactly to plan
More than 1.0 means they’re outperforming the plan
Examining the impact of stalled work
We analyzed 156 drywall framing and 154 mechanical ductwork activities from historical projects globally that were tracked by Buildots. These two critical interior fit-out activities often sit on the critical path.
The pattern was clear. When an activity has one or more ‘Zero-Progress Weeks’ (where planned progress didn’t move forward at all), even many weeks later, the work is statistically less likely to be back on plan. A pause becomes a lasting scar.
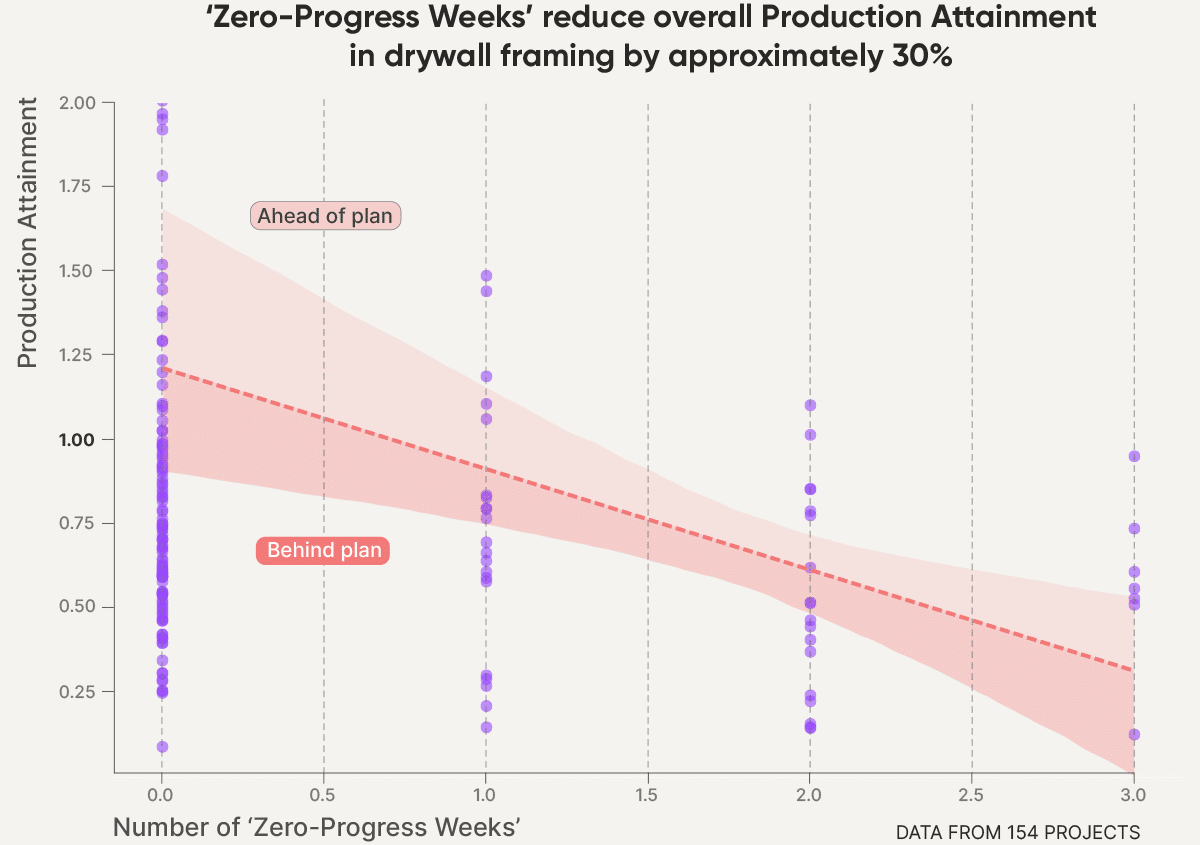
Drywall framing ‘Zero-Progress Weeks’ vs. Production Attainment
Our analysis of 156 global projects shows a strong negative correlation (-0.30). Each ‘Zero-Progress Week’ acts as a drag on future performance, reducing overall Production Attainment by approximately 30%. In framing workflows, a stop doesn't just delay completion, but degrades the crew's efficiency when work resumes.
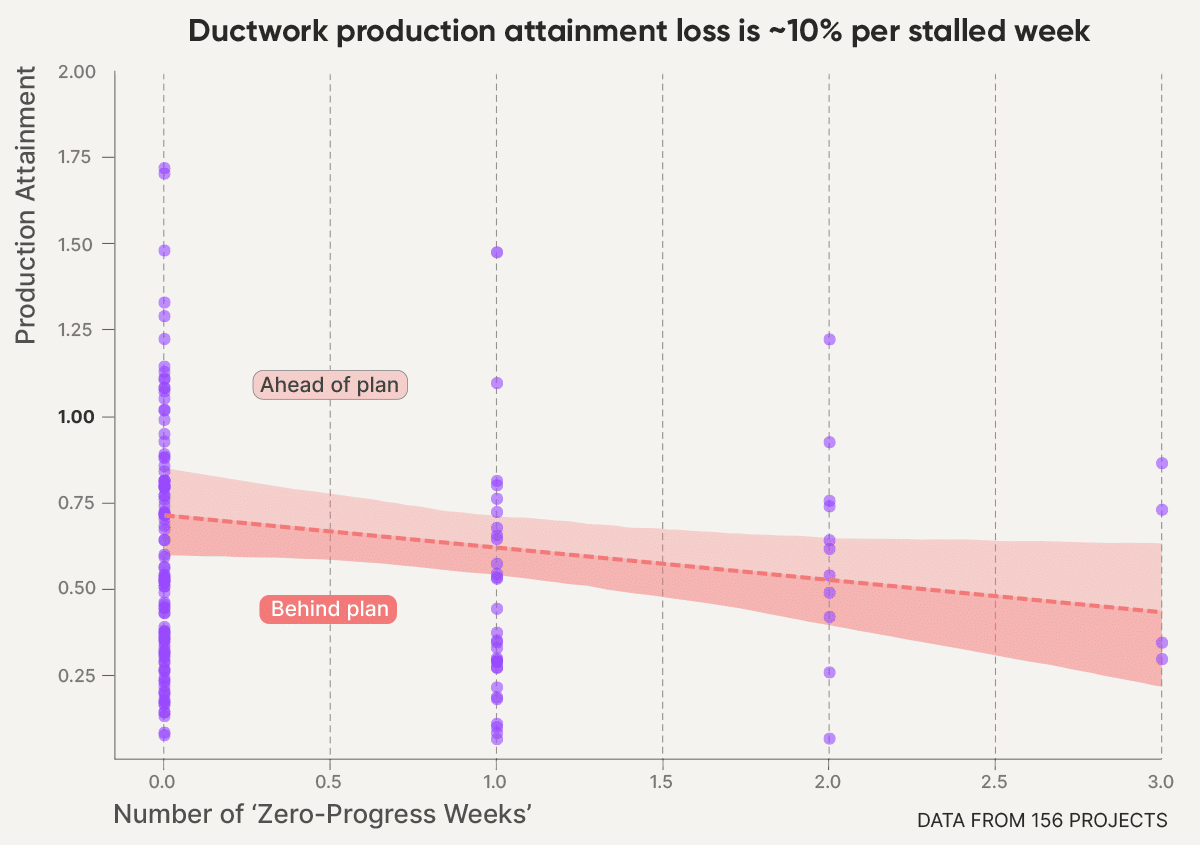
Mechanical ductwork ‘Zero-Progress Weeks’ vs. Production Attainment
Our analysis of 154 global projects shows a negative correlation (-0.09), meaning intermittent stops result in a cumulative 10% efficiency loss per ‘Zero-Progress Week’. While the individual weekly drop is lower than framing, repeated pauses in complex mechanical installs compound quickly, eroding schedule buffers through a steady efficiency bleed.
So, what does this mean for me?
The point of sharing this insight isn’t to deliver bad news, but to give you an early signal you can act on. You can think of a ‘Zero-Progress Week’ like a red warning light for workflow health, and a trigger for immediate action. We’d encourage you to keep an eye out for this on your projects and see if it rings true.
To be clear, this is a correlation, not proof of a single root cause. But the pattern is consistent enough that we believe it’s worth noting.
Tactical control for Project Managers and Superintendents
If you’re running a job, the takeaway is straightforward. You should treat a ‘Zero-Progress Week’ as an emergency until proven otherwise. That means:
- Investigate immediately: Don’t wait for the variance report to confirm what the field already knows. If an activity didn’t move this week, ask why now. Is the cause RFIs? Trade clashes? Access? Materials? Crew availability? Design readiness?
- Remove constraints fast: The fastest recovery is usually not pushing harder later, but unblocking the work today so you don’t accumulate more stopped weeks.
- Make the cost visible: This gives you a data-backed way to explain urgency. For example, by saying “If this activity sits still again next week, the likelihood of recovering to plan drops sharply, and we risk carrying a lasting efficiency penalty through the rest of the work.”
Portfolio control for executives
At a leadership level, the opportunity is bigger than one delayed activity. This pattern can become a simple, standardized way to spot risk early across a portfolio.
- Track work continuity as a leading KPI: ‘Zero-Progress Weeks’ give you a view into workflow breakdowns before the project declares a miss.
- Benchmark teams and replicate what works: Over time, you can identify which teams consistently minimize stalled weeks – and what planning, coordination, or constraint-management habits enable that.
- Shift reviews from opinions to signals: Instead of debating whether a project is ‘green’ or ‘yellow,' leadership can identify distressed projects based on a high frequency of zero-progress weeks long before those projects report a missed milestone.
Bottom line
Just as a canary warns miners of invisible danger, a ‘Zero-Progress Week’ warns project teams that an activity is losing its ability to meet commitments. Track it, treat it seriously, and use it as a trigger to intervene early – before recovery becomes impossible.
Want construction efficiency insights backed by real data?
Get our best weekly insights, curated into one monthly briefing.