Timeline: The automated Gantt-like view powering performance-driven construction
TL;DR Timeline automatically presents your construction progress data in a familiar, Gantt-like format. Clearly see what’s on track, what’s delayed, and what to do next. Read on to learn why it could be your secret sauce in putting performance-driven construction management into practice…
Construction projects are complex, with countless moving parts that must stay on track if a project has any chance of completing on time.
To tame this complexity and keep projects moving, most project managers rely on their Gantt schedule for reporting, tracking progress, and planning. As one former project manager told us, “The Gantt schedule is my Holy Grail. It took me weeks to put together, and I rely on it to keep my client updated – even if manual weekly updates take me ages and are occasionally forgotten.”
The problem: Limited visibility and time-consuming manual updates
But there’s a problem here. The traditional Gantt chart requires a lot of manual updates to keep it current and valuable. Doing this regularly can take hours. And even though project teams know it’s essential, it can often fall by the wayside.
There’s also the issue of limited visibility and incomplete data. Many site teams lack in-depth progress data to allow them to create a highly accurate Gantt schedule of project progress.
So, there’s a clear opportunity to deliver a better, Gantt-like experience for construction teams that bridges the gap between planned timelines and actual execution.
The solution: A Gantt-like view you know, with added AI magic
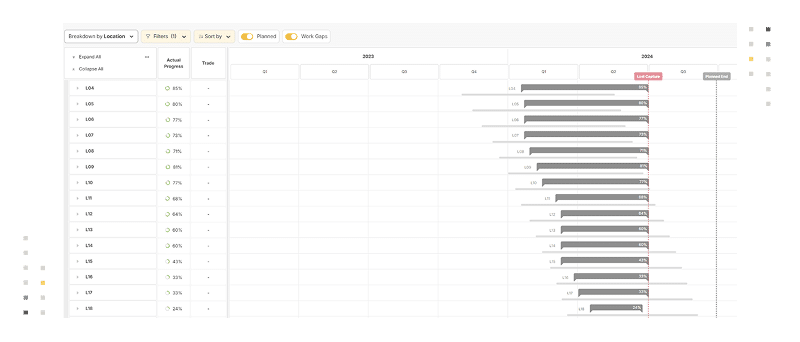
Enter Timeline. Buildots’ newest feature brings the best of Gantt into the modern age with AI progress tracking. In a nutshell, Timeline shifts the focus from planned activities to actual progress while maintaining the visual format you know and love.
How Timeline enables performance-driven construction management
Timeline helps teams implement Buildots’ performance-driven construction management methodology (PDCM) – a proactive approach for identifying and addressing minor setbacks before they escalate into major delays and issues.
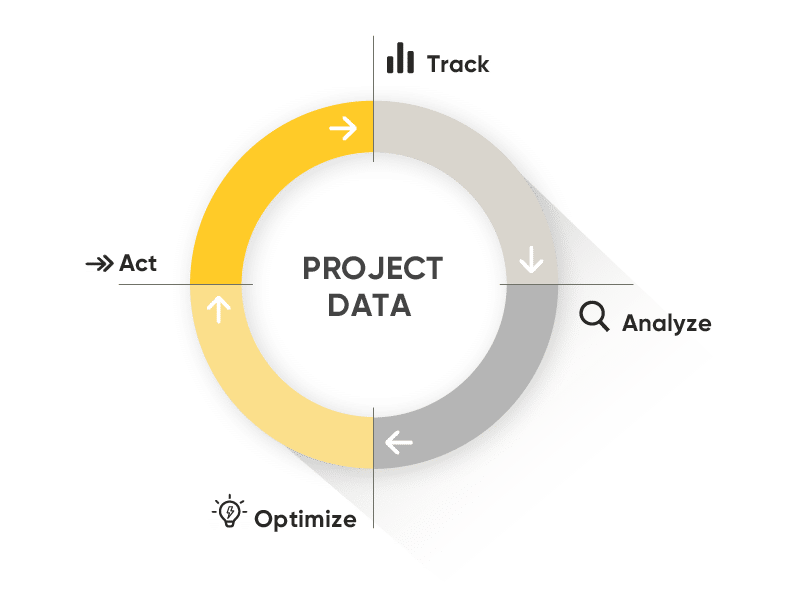
Timeline plays a key role in the analyze stage of the PDCM framework. PDCM relies on precise progress data that reflects ongoing construction activities, such as work completed by different subcontractors in specific areas, timelines of task completion, and any schedule deviations. By offering a clear view of this, Timeline ensures both operational teams and senior managers can analyze the data effectively and drive continuous improvement.
Timeline in the real world
Here are a few ways Buildots’ customers are already using Timeline:
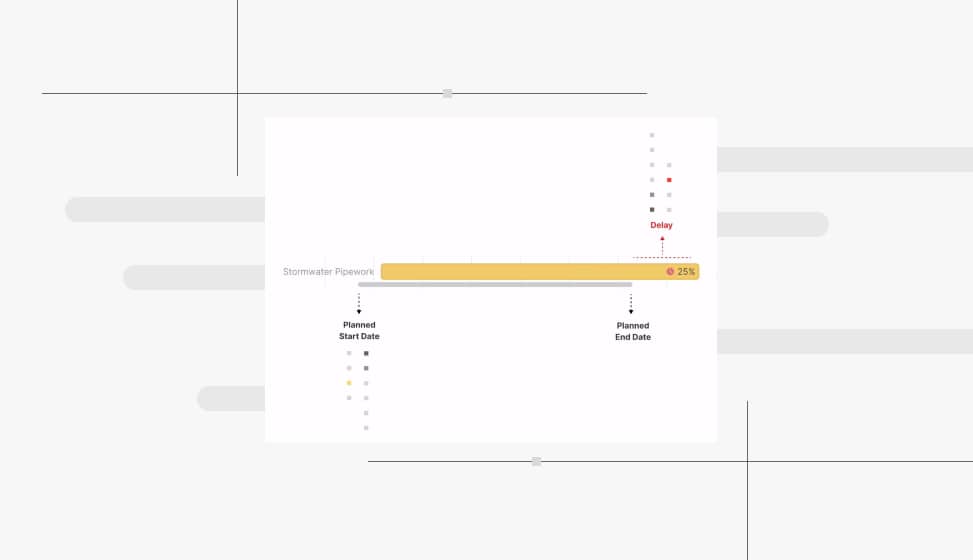
Early delay identification:
Project teams need to identify delays as early as possible. Timeline enables them to do this by analyzing progress in an intuitive visual format. For example, a project manager might see the sprinkler trade is significantly behind as it started late, enabling him to work with the trade to avoid delays snowballing further. Timeline can be used in conjunction with Delay Forecast. For example, after seeing a task started later than planned in Timeline, users can consult Delay Forecast to understand the pace now required to meet the planned end date and then compare it with recent pace to see if it’s achievable.
Reporting:
Many stakeholders prefer Gantt-like visualizations to understand project status, as they find this view more intuitive for identifying risks and understanding project status. Timeline allows teams to dive deeper into when activities started and finished and how actual progress aligns with the planned schedule. One senior project leader noted that Timeline lets him report on <1% marginal progress, which he finds particularly useful when approaching the end of projects.
Monthly trade meetings:
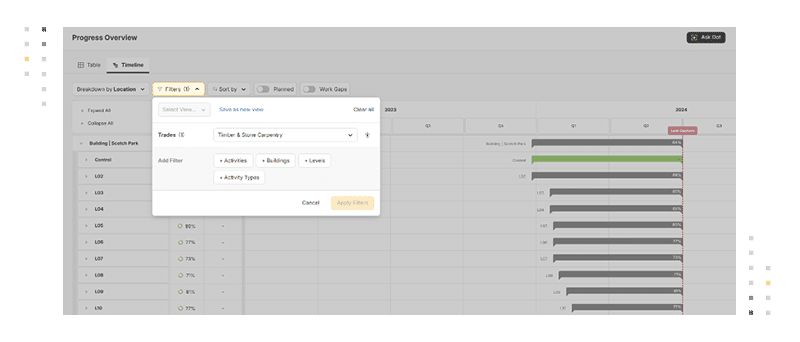
Timeline offers a clear, automatic visual representation of trade progress, helping teams align on delays, priorities, and next steps. No manual work is required, and you can filter by trade, activity, or location to focus on what matters most and tailor Timeline to your needs.
Better planning with historical data:
Teams can use historical progress data to improve the planning and sequencing of activities for similar projects or future phases. For example, a planner or superintendent reviewing drywall installation times on previous floors can adjust timelines for future levels, ensuring smoother sequencing of trades.
The bottom line
For construction professionals looking to align teams, track progress with clarity, and make informed decisions, Timeline delivers a game-changing advantage. Seamlessly integrating with Buildots’ AI-powered insights, it transforms project scheduling from a static task into a dynamic, performance-driven tool.
Better progress visibility matters to you; the next step is trying to prevent delays before they happen.
Watch our on-demand webinar to see how Buildots' Line of Balance tool helps project teams spot blockers and adjust pacing to stay on track.