From firefighting to foresight: Introducing Executive Overview
For construction leaders overseeing complex portfolios, uncertainty is often part of their day-to-day, with multiple live projects, countless variables, and no unified way to monitor progress.
Project updates trickle in from every direction. Each has a different structure, timing, and level of accuracy, creating a fragmented picture of progress that, though valuable, can leave even the most seasoned executives feeling like they’re only looking at half the picture.
This uncertainty comes at a cost. Senior leaders are often the last to know when a project veers off course. And by the time problems reach them, it’s often too late to intervene proactively. Instead, leaders are pulled into firefighting mode.
The solution: Executive Overview
Buildots’ Executive Overview (now available for enterprise users) gives construction executives the clarity they’ve been missing. It offers a high-level, standardized view of every active project, so leaders have a bird’s eye view of their portfolios and can step in to make a difference.
It can help you answer questions like – are we on track towards our next milestone? What’s our progress or delay trend – is it better or worse than last week? Is the project team owning and handling any delays? Here’s how it works in action:
See performance at a glance
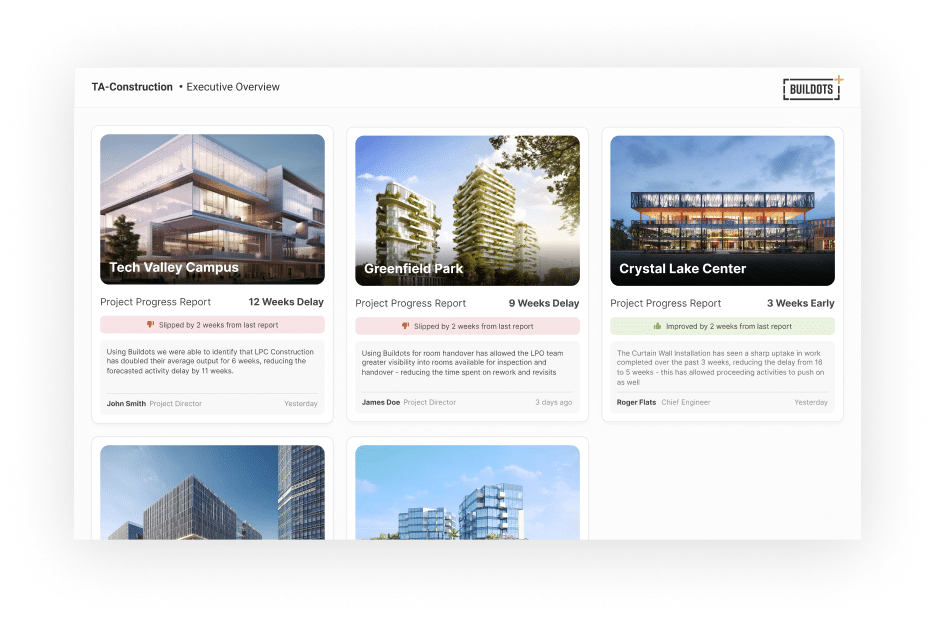
Each tile in Executive Overview represents a live project – as the above image shows. Color indicators immediately show which projects are on track, which are underperforming, and where attention is needed. Also included is commentary from your team giving context to the data and sharing mitigation plans (more on this below).
This gives executives immediate data-driven insights into emerging risks and the ability to intervene decisively when fixes are still simple, and costs are still low.
Standardize reporting across all projects
Often, you’ll hear that ‘everything is more-or-less fine’ on a project. Until suddenly, it’s not. You’re blindsided by a three-month delay, and the warning signs never made it to your desk. Meanwhile, you’ve been focusing all your attention on a different project that’s only half as far behind.
The problem is scattered, subjective and inconsistent reporting that masks real risks. Executive Overview changes that. With one standardized reporting format across all projects, you get a clear, unbiased view of where things actually stand. It’s easy to compare performance side-by-side and spot which projects need your focus… before issues spiral.
Feel confident that project teams are owning issues
Objective data is essential, but it doesn’t tell the whole story. That’s where your project team’s insight comes in. Each week, project managers add concise, free-text commentary to Executive Overview that brings critical context to the numbers, highlighting key issues, explaining mitigation plans, and clarifying what’s behind the trends. This allows you to build collaborative, trust-based relationships with your teams.
Drill into delay root causes
Most of the time, you trust your project team to keep things on track. But when something doesn’t feel right, or you need to dig deeper, you can turn to the Activity Report.
As part of Portfolio Dashboard, this tool highlights specific activities driving project delays and lets teams surface both the data and the reasoning behind any issues.

Not micromanaging, but powering a performance-driven approach
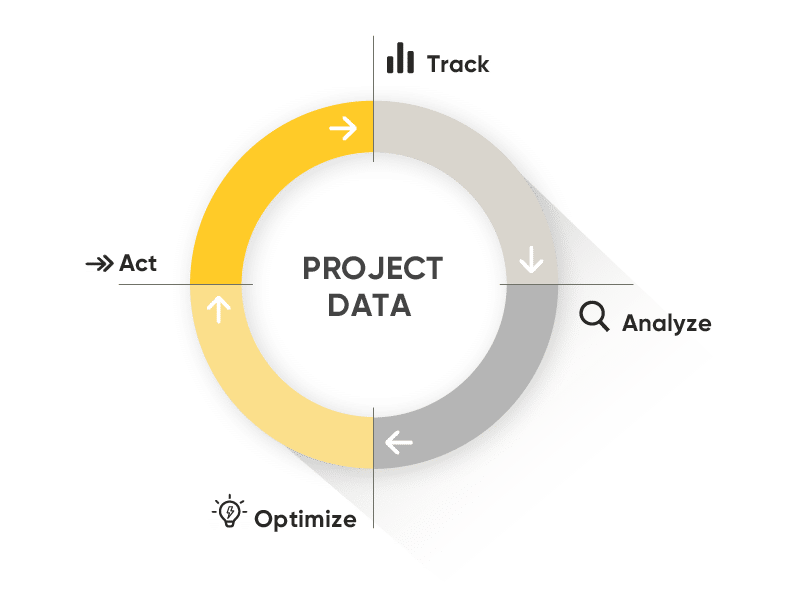
The new Executive Overview is critical in enabling Performance-Driven Construction Management (PDCM) at scale. It strengthens the Track phase of the PDCM cycle by giving executives a consistent, objective view of actual progress towards an agreed milestone or scope. Instead of reacting to surprises, leaders can anticipate them and shape better outcomes.
This isn’t about micromanaging or watching every detail. It’s about knowing where to look, when to step in, and how to make the greatest impact. As Mark Bessey, Regional Director Midlands at Sir Robert McAlpine, puts it, “Executive Overview gave me instant clarity on project health across the board. Instead of waiting on reports or chasing updates, I could see exactly where attention was needed and take action quickly. It helped us shift from reactive management to data-driven leadership.”
We envision this becoming senior leaders’ go-to. It’s not just a tool to inform your monthly meetings (though it is invaluable for this!), but something you can refer to throughout the month. For project managers, it’s about streamlining reporting. With Executive Overview, they can replace hours of creating and formatting a manual document with a simple, auditable summary, hopefully minimizing the number of late-night emails and text messages.
A win-win situation.
Executive Overview was originally known as the Portfolio Dashboard.
Want to see how top contractors are tackling similar challenges?
Watch this executive webinar featuring senior leaders from Mace, SRM, and former MD of Wates as they share practical strategies to improve multi-project oversight.

