Grounding ambition in evidence: Benchmarking healthcare planning
Predictability is key for the construction industry, but in the healthcare sector, it’s more than a project management KPI – it’s a clinical necessity. When a project slips, it isn’t just a budget issue; it’s a delay in patient care.
To achieve true predictability, contractors and executives need more than “gut feel”. They need a baseline of what “reasonable” actually looks like. That’s why our team analysed weekly planned production rates across healthcare projects for North America and the UK, to establish industry-wide benchmarks for key trades in Interior (or Architectural) and MEP (Mechanical, Electrical and Plumbing). Take a look at the results for each region below:
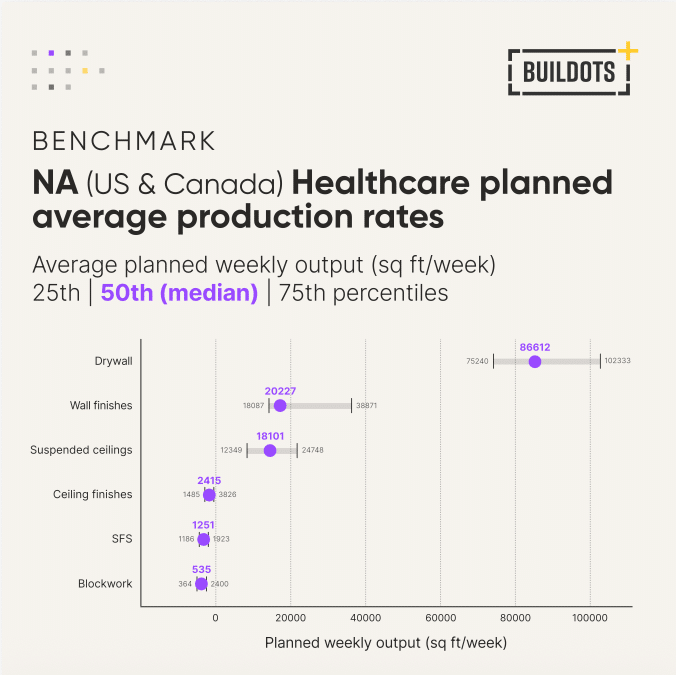
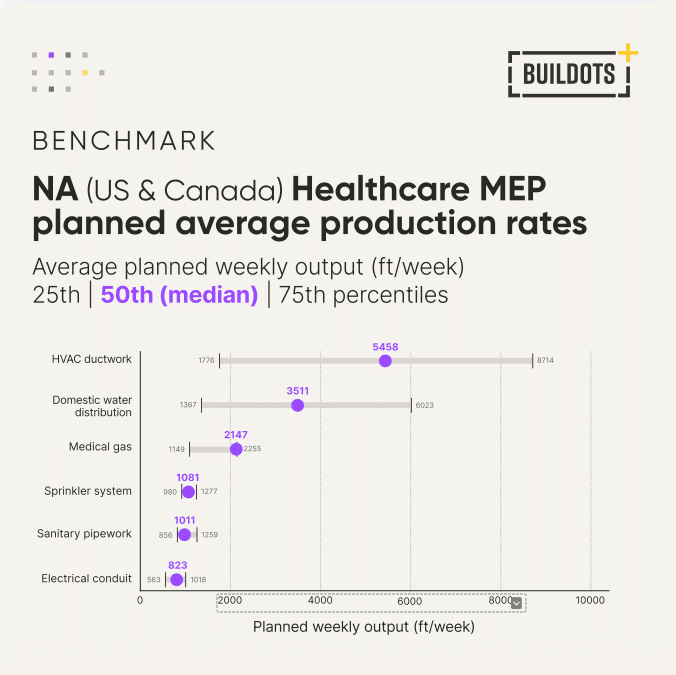
North America Benchmarks
| Median benchmark for interior planned production rates (sq ft/week) | Median benchmark for MEP planned production rates (ft/week) |
| Drywall – 86,612 Wall finishes – 20,227 Suspended ceilings – 18,101 Ceiling finishes – 2,415 SFS – 1,251 Blockwork – 535 | HVAC ductwork – 5,485 Domestic water distribution – 3,511 Medical gas – 2,147 Sprinkler system – 1,081 Sanitary pipework – 1,011 Electrical conduit – 823 |
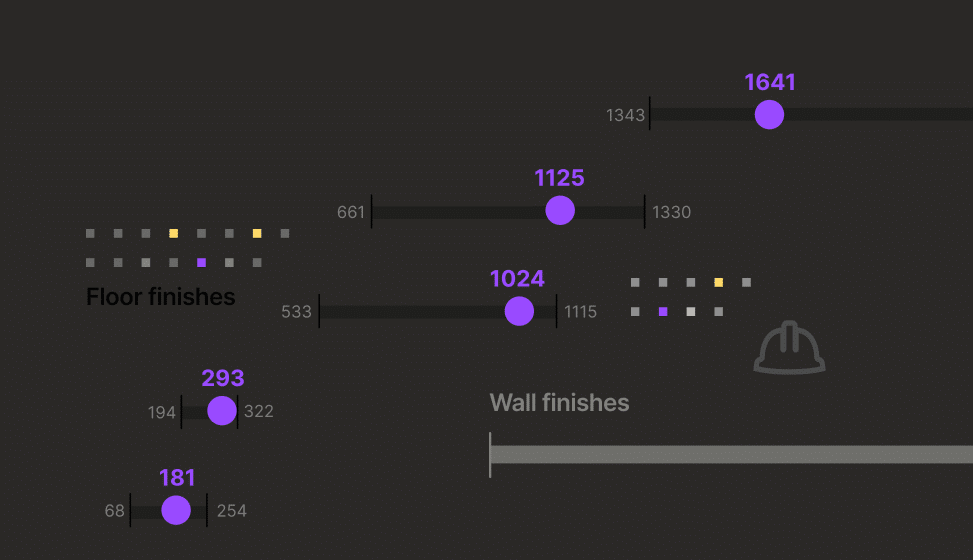
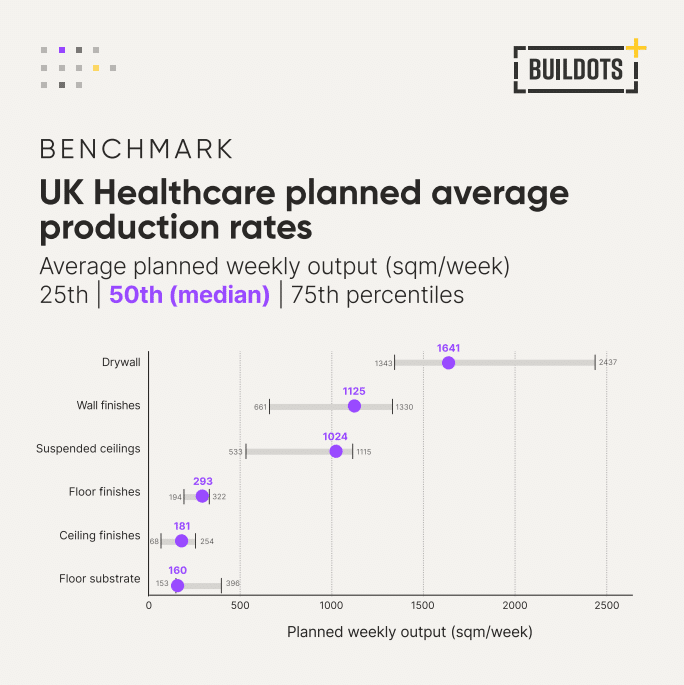
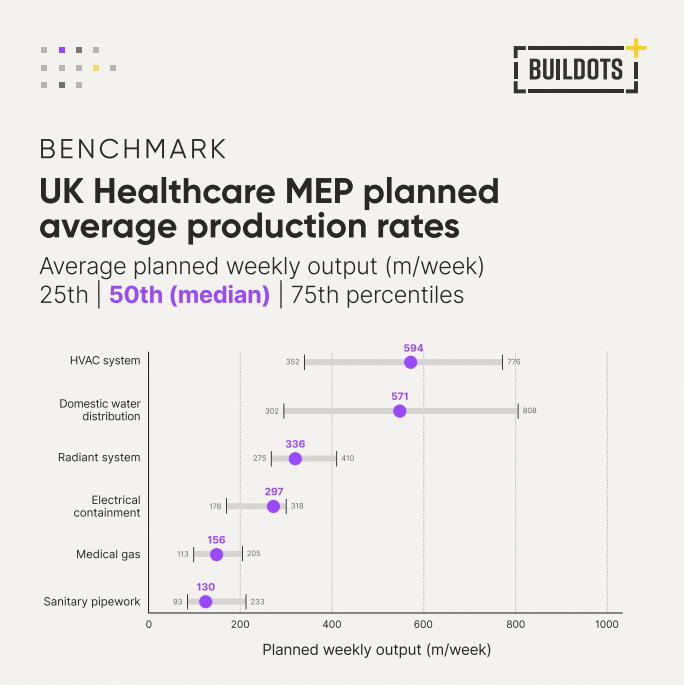
UK Benchmarks
| Median benchmark for interior planned production rates (sqm/week) | Median benchmark for MEP planned production rates (m/week) |
| Drywall – 1,641 Wall finishes – 1,125 Suspended ceilings – 1,024 Ceiling finishes – 2,415 SFS – 293 Blockwork – 160 | HVAC system – 594 Domestic water distribution – 571 Medical gas – 336 Sprinkler system – 297 Sanitary pipework – 156 Electrical containment – 130 |
So, what does this mean?
So what does it mean for you, beyond the weekly report? Knowing what reasonable looks like gives you the following benefits:
- Competitive Edge: Know if your production rates actually stack up against the market.
- Realistic Scheduling: Stress-test your entire program’s assumptions against historical facts.
- Commitment Accuracy: Ensure your promises to stakeholders are backed by data, not hope.
By benchmarking your production rates against these North American and UK benchmarks, you can move beyond hope-based scheduling to create realistic, data-backed programs. This gives you greater predictability for your projects, giving you a competitive advantage while safeguarding the patient care that depends on your timely delivery.
Want construction efficiency insights backed by real data?
Get our best weekly insights, curated into one monthly briefing.