Inside the planning gap threatening on-time education openings
Recently, my team and I have been looking closely at planned versus actual production rates across different construction verticals. What we’ve found is consistent and concerning. There’s a wide variation in how much work teams plan to complete each week from project to project, and more importantly, a persistent gap between what’s planned and what actually gets delivered on site.
This week, we turned our attention to education construction. It’s a sector that brings this issue into sharp focus because of how unforgiving its deadlines are. While all construction projects work to schedules, schools and universities don’t have the luxury of flexibility. Buildings need to be ready for the first day of term.
When that doesn’t happen, the consequences are severe: students without classrooms, staff working around incomplete facilities, and institutions scrambling to put temporary solutions in place. Many of these projects are also publicly funded, which means delays are highly visible and closely scrutinized within communities.
Despite all this, the data shows that many education projects carry significant risk long before construction even begins.
The planning gap
Across the industry, weekly production targets are often set based on assumptions or best-case scenarios, rather than on what similar projects have consistently delivered in reality. Once construction is underway, the difference between planned and actual production begins to surface, often too late to fully recover without disruption.
To understand this gap more clearly, we analyzed real project data from education builds across North America and the UK. The benchmarks look at both planned and actual weekly production rates across a range of activities, from envelope work to MEP systems, and present them at the 25th, 50th (median), and 75th percentiles.
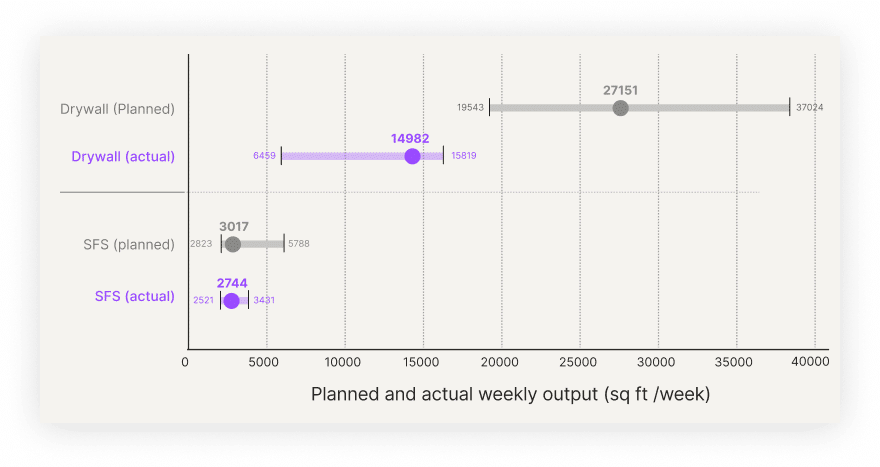
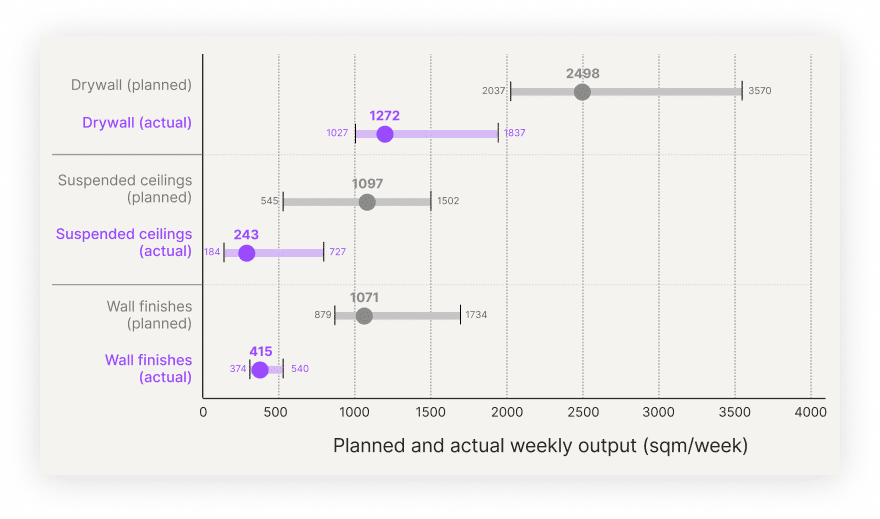
Across these projects, a consistent pattern emerged: planned production rates tend to exceed what’s actually achieved.This is visible even in trades that are typically considered predictable. Take drywall, for example, a high-volume, repeatable activity. Here, the data shows not only a significant difference between what teams plan to deliver each week and what is typically achieved, but also a particularly wide gap between planned and actual production rates. Planned output is a median of 27,151ft in the US (and 2498m in the UK), compared to actual median delivery of 14, 972ft (or 1272m in the UK), a meaningful shortfall in a trade that often sits on the critical path. That means median output is ~45–50% below plan across both North America and the UK.
NA envelope graph
UK envelope graph
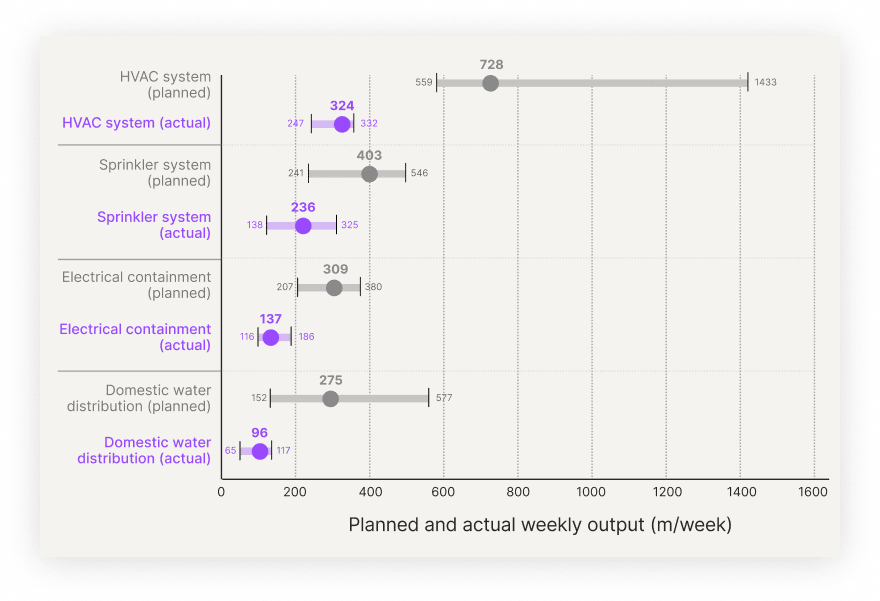
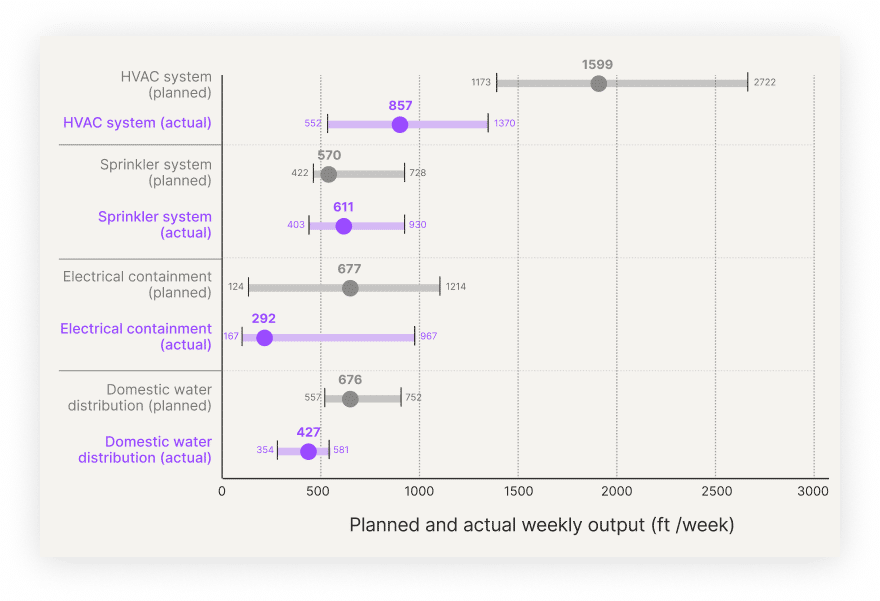
The same pattern appears in MEP. In HVAC installation, where coordination and complexity are higher, both the spread of planned production and the gap to actual delivery are pronounced. Median planned rates of 1599ft per week (or 728m in the UK) contrast with actual installation, which is a median of 857ft per week (or 324m in the UK). This reveals an even wider delivery gap than drywall, with median output falling short of plan by ~46% in the US and ~56% in the UK.
NA MEP Graph
UK MEP Graph
The fact that both drywall and HVAC (two key critical path activities) show some of the largest discrepancies is particularly telling. It underscores that the gap isn’t confined to secondary trades or edge cases but is embedded in the core of how projects are planned and delivered.
Together, these benchmarks point to a broader industry reality: what we say we’ll build each week is not always aligned with what projects typically achieve.
Why this matters
In any project, a gap between planned and actual production creates pressure on the schedule. But in education, that pressure is amplified.
With fixed opening dates and little room for delay, underperformance can’t easily be absorbed. When planned rates prove unrealistic, teams are forced into reactive measures, compressing timelines, increasing labour, or resequencing work, all of which introduce additional risk and cost.
In that sense, planning decisions are not neutral. Setting production targets above what is typically achievable effectively builds risk into the project from day one.
From optimistic plans to predictable delivery
By using industry benchmarks that reflect both planned and actual performance, teams can set schedules and production rates based on what is realistically achievable, not just what is hoped for. Percentile-based benchmarks, in particular, allow planners to make conscious decisions about risk.
For education projects, this shift can make a meaningful difference. More grounded planning leads to more reliable schedules, better-aligned resourcing, and ultimately, a higher likelihood of opening doors on time.
Want construction efficiency insights backed by real data?
Get our best weekly insights, curated into one monthly briefing.