From knowing where you stand to predicting where you're headed

Aviv Leibovici
Chief of Product & Co-founder at Buildots
share
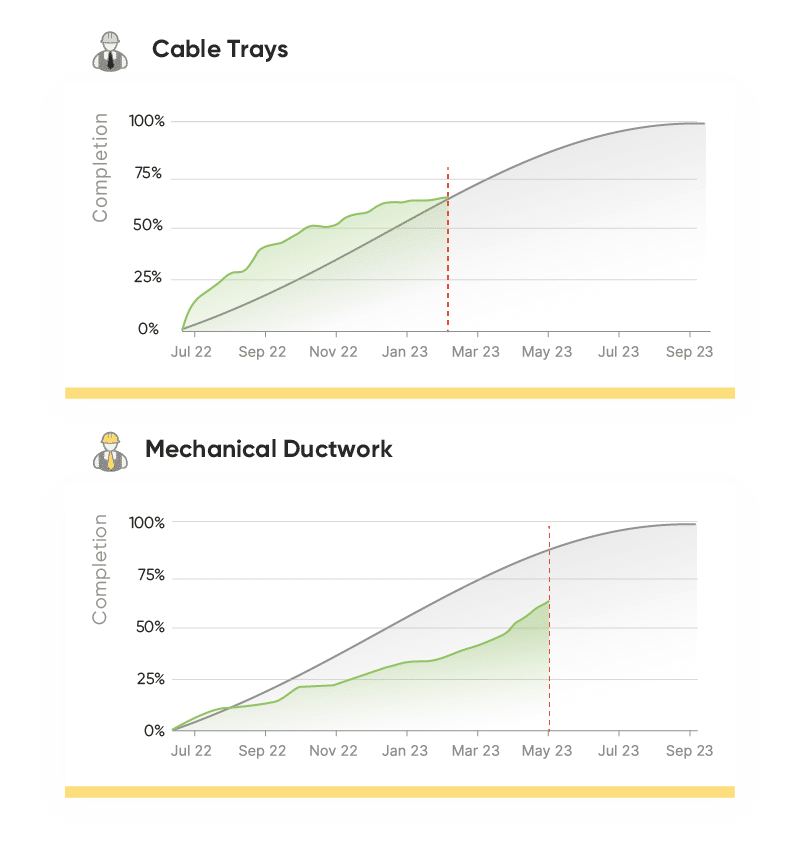
It’s Tuesday morning on site and progress reports are starting to land on your desk. Dan from Electric Cable Systems reports that he has installed 65% of the cable trays, just slightly ahead of the 64% plan. While you’re relieved by the report, moments later, you learn that mechanical ductwork is falling behind, with only 62% of the work completed against the 90% expected by now.
Your initial reaction is concern. You start to think about the implications down the line: How is this going to implicate the ceiling closure? Is this the beginning of a long chain of delays? And is there anything you can do about it?

But what if there's more to the story? Let’s shift perspectives for a moment
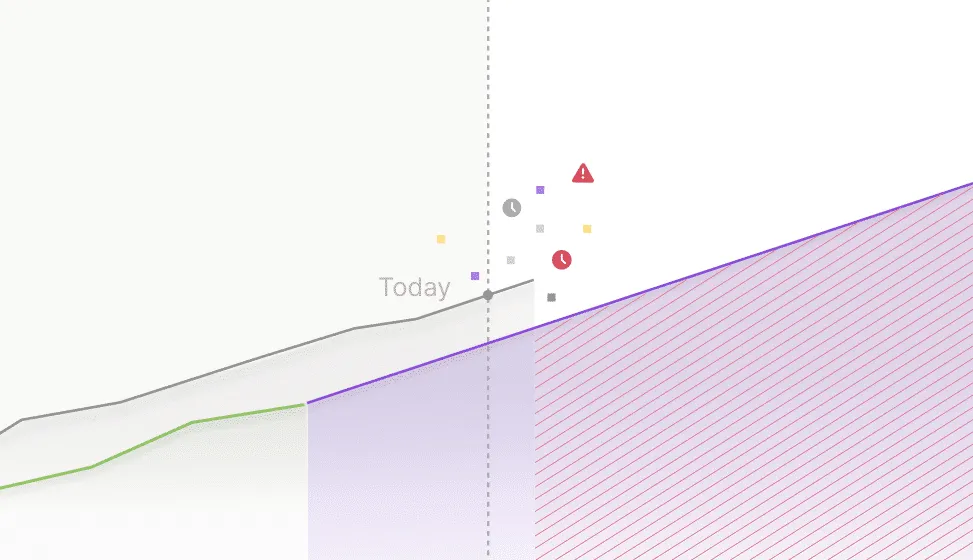
Imagine if you could extend that snapshot and observe the weekly progression of each trade's work over time up to today. What if you could see that Dan's seemingly smooth progress is actually moving slower than needed, risking critical deadlines due to a consistent slow pace over the last four weeks? Or discover that mechanical ductwork has actually been moving at a higher speed and now appears on track to meet the deadline? Such insights could lead to a strategic shift in focus and resource allocation, ensuring that your focus and attention is well calibrated.
But such a level of insight is not easy to obtain. Progress tracking itself is already challenging enough. It is labor-intensive, subjective, and heavily dependent on accurate reporting from a big array of stakeholders. Adding the capability to track trends and trajectories further complicates this task, demanding a much more intricate level of data analysis. Traditional methods often fall short of accurately reflecting the current status of a project, and expecting them to provide a deeper level of insight seems even more far-fetched.
Buildots is tackling this gap with an innovative solution: the Delay Forecast feature. This feature employs predictive analytics to reveal both the current and potential future states of project activities. Delay Forecast enhances the data and insights already made available by Buildots, transforming them into strategic foresight that shifts project management from reactive to proactive.
How it works
We’ve integrated a prioritized list of activities into the Buildots main dashboard, flagging those at risk of delay. Each activity includes additional insights such as the estimated completion date based on recent progress, an analysis of past and average paces, and the required pace to meet original deadlines. The pace is calculated and presented in units specific to the activity type. Users can view a timeline of planned vs. actual progress, and simulate various pace scenarios to see potential impacts on the delivery timeline.
Why Delay Forecast matters
With access to hundreds of activities and their exact progress over time, Buildots own data study reveals that 62% of construction tasks run slower than planned, quietly but significantly impacting the project. About one in every four activities progresses at only half the expected pace. The Delay Forecast feature is designed to highlight these issues early, integrating seamlessly with Buildots to enhance your project management capabilities.
Incorporating the Buildots Delay Forecast into your toolkit allows you to:
- Identify activities that are at risk of delays before they become critical
- Communicate necessary adjustments to trades in real-time
- Prioritize resources effectively to keep your project on schedule
- Monitor the impact of these adjustments as they occur
Returning to our Tuesday scenario, Delay Forecast indicated that the early lead of the cable trays' installation had been slowing, with progress declining over time. Meanwhile, mechanical ductwork was adjusting well, now moving safely towards meeting the deadline. Vital insights of this sort enable strategic reallocation of resources and schedule adjustments before setbacks turn into costly delays.
Testing Delay Forecast on several key projects covering dozens of activities has shown that Delay Forecast can flag potential delays and accurately estimate their duration as early as four weeks into an activity. Early adopters who implemented and used the feature reported a staggering 50% reduction in delays saving months of costly delays.
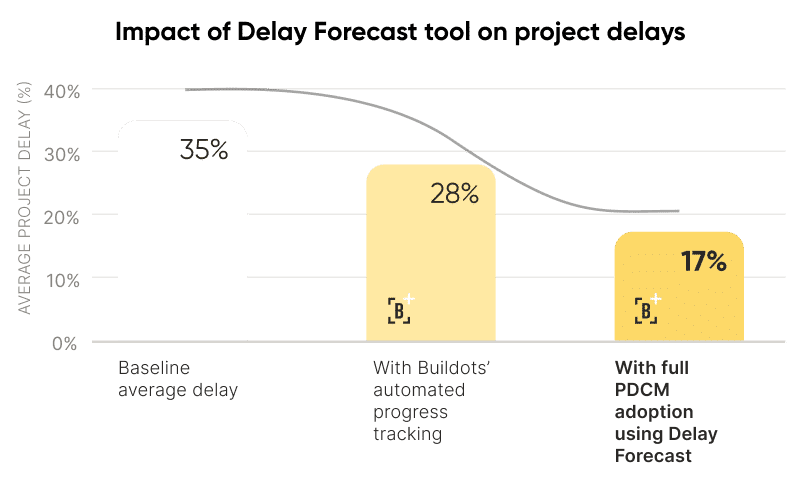
Using Buildots' Delay Forecast tool gives you a strategic advantage in the complex world of construction project management. It empowers project teams to make informed decisions that not only keep your projects running but also help them excel, ultimately saving weeks of potential delays and securing your project’s margins.
Want a closer look at Delay Forecast? Watch this live demo >>
Aviv Leibovici
Chief of Product & Co-founder at Buildots