Are your trades on track? 4 essential metrics will tell you

In an industry where every detail matters, project managers require a steady stream of indisputable data from their construction sites to ensure successful project delivery. While project managers frequently encounter unpredictable factors such as supply chain disruptions or weather-related setbacks, trades management is one key area that can be effectively overseen.
In the following, we will examine four essential metrics every superintendent should use to improve trade performance and make the most out of the workforce they have on site.
Desired Activity Pace
Desired Activity Pace is a metric that calculates the optimal speed at which an activity needs to progress to meet a deadline. Note, the desired activity pace will change throughout the project, especially when there are delays or changes in the schedule.
Why it matters
The Desired Activity Pace serves as a foundational guidepost, setting the target for the activity. By determining the right pace, we can ensure that the work progresses in line with the particular timeline.
Did you know?
Activities often start at a slower pace due to a learning curve and pace becomes more consistent as the work progresses. By factoring in this learning curve and aligning the pace with the activity’s deadline, we can increase the likelihood of meeting project milestones.
Trades Throughput Consistency
Trades throughput consistency measures the stability of a subcontractor’s activity over the course of time. It takes into account fluctuations that may occur due to weather conditions, planning deviations, delays from preceding trades, or unexpected design changes.
Why it matters
Maintaining output is crucial for achieving a deadline. Variations in work speed can disrupt the schedule as a whole. Throughput Consistency ensures that once the desired pace has been calculated, it is maintained throughout the entire project.
Did you know?
In a recent study, we found a strong linear correlation between output inconsistencies and project delivery delays. The more consistent a project’s output, the more likely it is to meet its deadline.
Percent Plan Complete (PPC)
Known in lean practices, Percent Plan Complete is actually a universally applicable metric that measures the percentage of tasks completed out of the total tasks planned on a weekly basis. It is important to note that PPC only accounts for tasks that were originally planned. Any additional work done that wasn’t in the initial plan doesn’t factor into this measure.

Why it matters
PPC measures a trade’s ability to stick to a plan, which is crucial for making a project more predictable. It’s about determining whether the work that was done aligns with what was initially set out. That’s why PPC is an indicator of the quality of your planning. If you’re not hitting high PPC rates week over week, it might not only indicate that your trades are not performing as promised – but could also suggest that you are overplanning.
Did You Know?
A healthy PPC rate is above 75%. However, in reality, typical rates are often below 40%. This is not just a number, it’s a reflection of how well your planning and your execution processes are aligned.
Labor Productivity
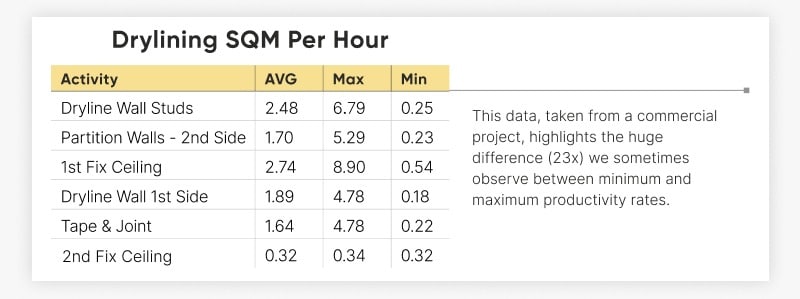
Labor productivity is the measurement of the amount of work completed per hour per worker. For example, if you’ve completed 1000 square meters of drywall installation in a specific week with a total of 1000 work hours, your productivity rate is 1.0 sqm/work hours. Keeping an eye on minimum, average, and maximum levels can help you identify trends, giving you a deeper understanding of work output relative to resources invested.
Why it matters
This metric can provide insight into the quality of the workforce a subcontractor brings to the table. Skilled labor can complete tasks more efficiently, so a higher productivity rate is often a sign of a more experienced and competent team.
Did you know?
We’ve found that, counterintuitively, when more workers are brought onto a project, productivity often decreases. This is likely because maintaining a high level of performance becomes more challenging with larger groups. By tracking their productivity, you can find the sweet spot between workforce size and performance, helping to avoid potential productivity decreases.
The power of these metrics lies in their combination
By starting with calculating the desired activity pace, ensuring that trades consistently achieve the planned work, and measuring the performance level of the trades, we gain valuable insights into the productivity and efficiencies of our teams and their ability to minimize rework. While these metrics are not the only ones to consider, they provide an excellent foundation for managing trades based on data rather than relying solely on intuition or assumptions
An efficient trade management using these metrics requires the right tools to do so. Performance-driven construction management practices enabled by solutions like Buildots simplify data analysis by automating progress tracking on-site and translating the progress data into performance metrics and forecasts.